Figure 4.
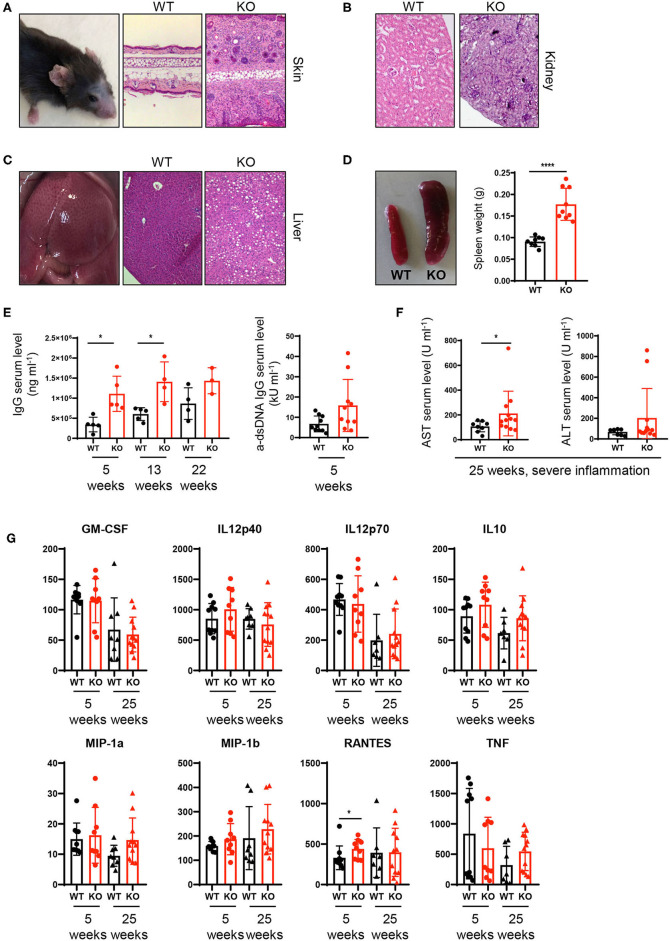
Spontaneous inflammatory infiltrates in liver and skin upon partial ablation of PTPN2 in DCs. (A–C) Representative pictures from H&E-stained sections of skin (A), kidney (B), and liver (C) of 25-weeks-old PTPN2fl/fl (WT) and PTPN2fl/fl × CD11cCre (KO) mice. (D) Spleen weight. (E) Serum levels of IgG and anti-dsDNA IgG. (F) Serum levels of amino transferases. (G) Serum levels of inidcated cytokines. Each dot represents one mouse [n = 9 mice (D), n ≥ 3 mice (E), n ≥ 8 mice (F,G)]. *p < 0.05; ****p < 0.00001 [two-tailed Mann Whitney test (D–G)]. Data are shown as ± s.d. (D–G).

