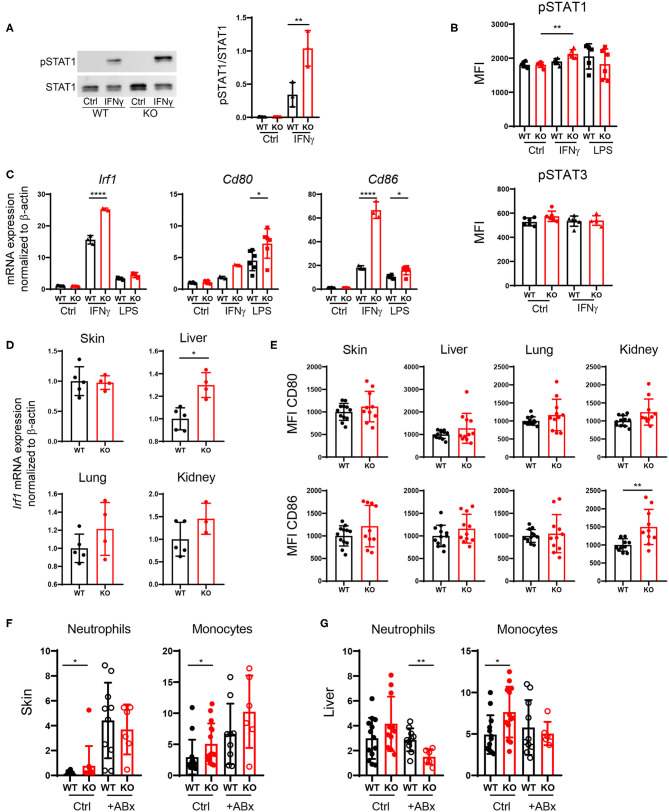
Figure 6.
Increased DC activation via upregulation of the IFNγ-STAT1 pathway. (A–C) BMDCs were generated from PTPN2fl/fl (WT) and PTPN2fl/fl × CD11cCre (KO) mice. (A,B) Phosphorylation levels of STAT1 and STAT3 determined by Western Blot (A) and Flow Cytometry (B). (C) mRNA expression of IFNγ pathway-associated genes. (D) mRNA expression levels of IRF1 in lysates of indicated organs. (E) Mean fluorescence intensity (MFI) of co-stimulatory molecules on cDCs. (F,G) Relative numbers of neutrophils and monocytes in skin (F) and liver (G) of 5-weeks-old mice after antibiotics treatment. Data are pooled from two independent experiments (A–C), representative of two independent experiments (D), pooled from three independent experiments (E), or pooled from three independent experiments (F,G) [n = 6 mice (A,B), n ≥ 3 mice (C), n ≥ 3 mice (D), n ≥ 10 mice (E), n ≥ 6 mice (F,G)]. *p < 0.05; **p < 0.01; ****p < 0.00001 [one-way ANOVA, Tukey's multiple comparison test (A–C,F,G); two-tailed Mann Whitney test (D,E)]. Data are shown as mean ± s.d (A–G).

