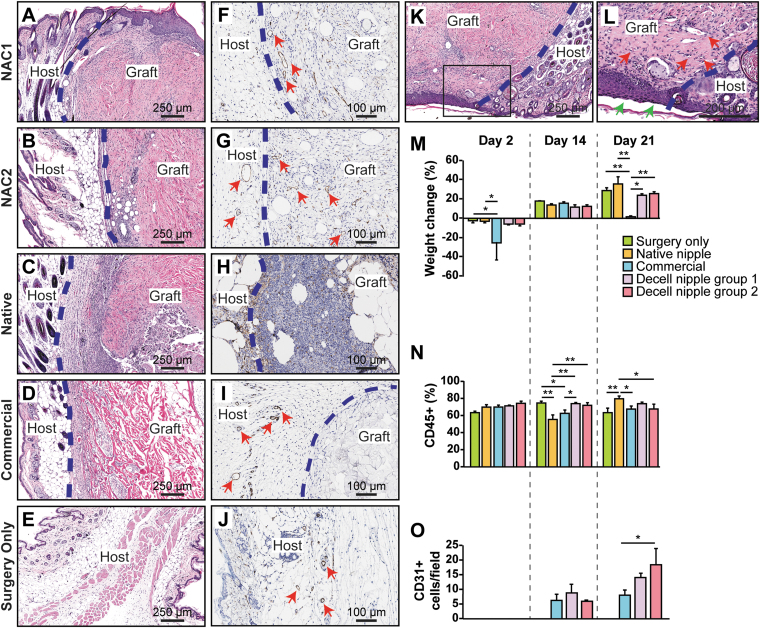
FIG. 5.
Subcutaneous implant mouse study. (A–E) H&E stains of decellularized nipple implants from 21 days postimplantation. (F–J) CD31+ stains of implants 21 days postimplantation. (K) Decellularized nipple implant exposed to air showing reepithelialization of implant. (L) Magnified black box region in (K). Green arrows point to epithelium. Red arrows point to blood vessels. (M) Graph showing percent weight change relative to day 0 weight of mice. (N) Graph of percent CD45+ (common leukocyte antigen). (O) Graph of CD31+ cells per field that were detected from histological analyses of resected grafts over time. One-way ANOVA with Tukey's post hoc test was performed. *p < 0.05; **p < 0.01. ANOVA, analysis of variance.

