FIG. 8.
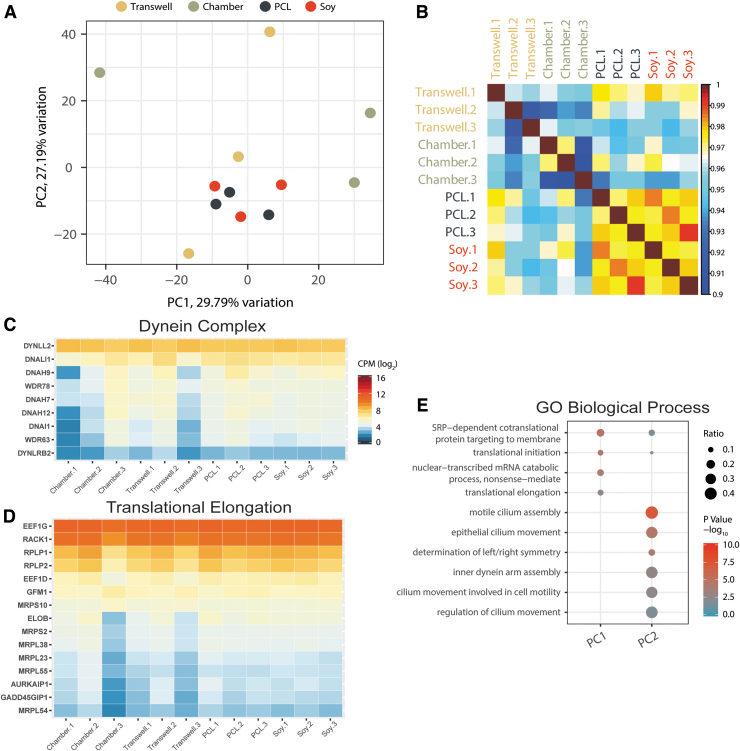
Variability in transcriptomes. (A) PCA using the log2 CPM values from 12,674 expressed genes. (B) Pearson correlation of each sample using the expressed gene log2 CPM values. “Transwell.1” is shown on the exterior to indicate similarities to the nanofibrous conditions. (C, D) Expression values of genes of two GO example pathways showing the highest batch variation, dynein complex (C) (GO:0030286) and translational elongation (D) (GO:0006414). Scale for both is equal to that shown in (C). (E) GO biological process enrichment for the top 500 genes that contribute to the factor loadings for each of the principal components 1 and 2. Replicates “1,” “2,” and “3” shown in (B), (C), and (D) indicate the first, second, and third batch replicates that were differentiated concurrently for each substrate type. PCA, principal component analysis.

