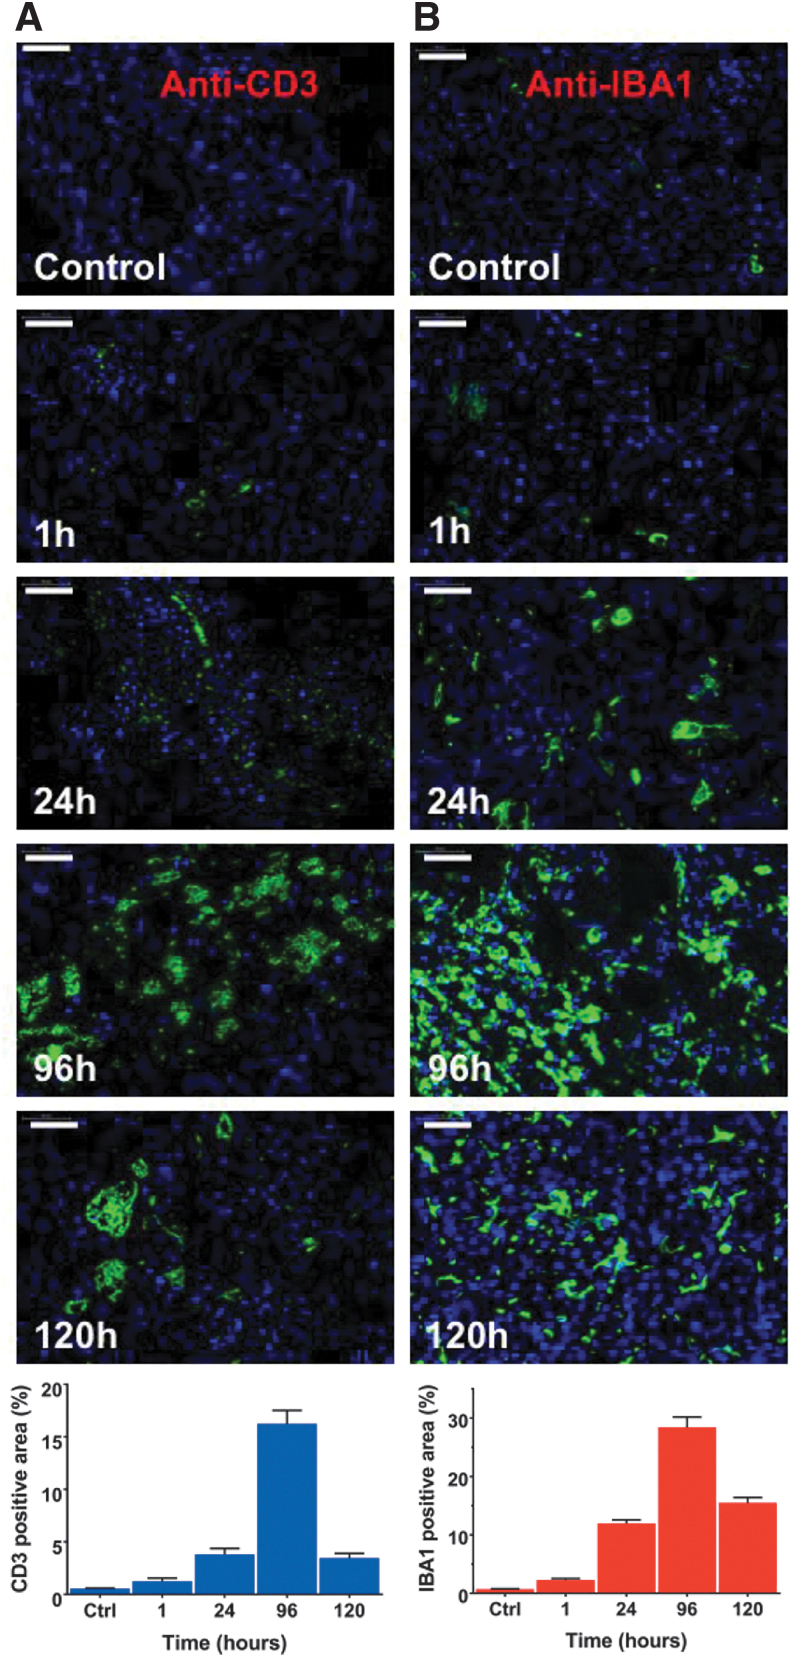
FIG. 5.
Immune cell changes in the syngeneic tumor microenvironment following treatment with [225Ac]αMSH-PEG-Cy5-C′ dots. Representative images of immune cells in the B16-F10 tumor microenvironment and quantification of signal (mean ± SEM). Tumor tissue was harvested at 1, 24, 96, and 120 h post-treatment and stained with (A) anti-CD3 and (B) anti-IBA1 immunofluorescence markers to identify time-dependent changes in T cell and macrophage populations, respectively. These tumor samples were obtained from the animals in the pharmacodynamic therapy study. Images of untreated tumor tissue are included as control (Ctrl). Immunofluorescence stains of T cells (green) and macrophages (green) counterstained with DAPI (blue). Scale bars are 50 μm. DAPI, 4′,6-diamidino-2-phenylindole.

