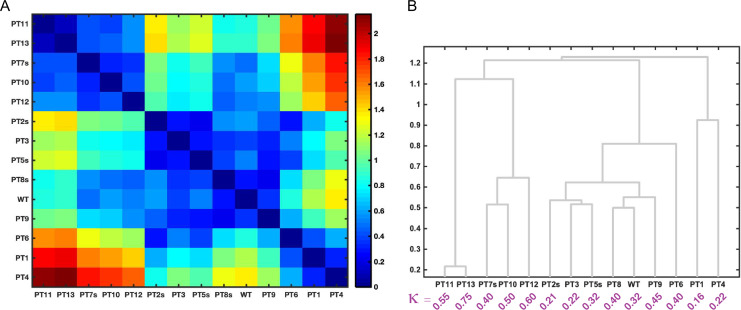
Fig. 6.
Comparative assessments of SERs for the RAM regions of NICD variants: (A) Checkerboard plot of the similarity between ensemble entropy matrices of the system of Notch-RAM variants. The dissimilarity between ensemble entropy matrices Sens,A and Sens,B is calculated as the Frobenius norm of the difference ensemble entropy matrix according to Equation (4). (B) Dendrogram of sequences grouped based on the similarities of their Sens matrices.

