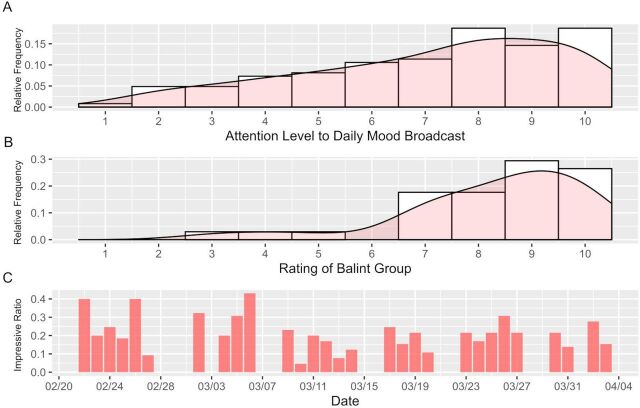
Figure 3.
Results of the follow-up investigation on the effectiveness of the psychological health support programprogramme. (A) Histogram of ratings of attention level to the daily mood broadcast. The vertical axis indicates the ratio of a given level of attention among all responses; (B) Histogram of ratings of the Balint group activities. The vertical axis indicates the ratio of a given level of rating among all responses; (C) Ratios of respondents who felt ‘impressive’ with the daily group chat. The horizontal axis indicates the dates of the group chat activities, and the vertical axis indicates the ratio of participants who report impressiveness about the activity among all participants in a given day.

