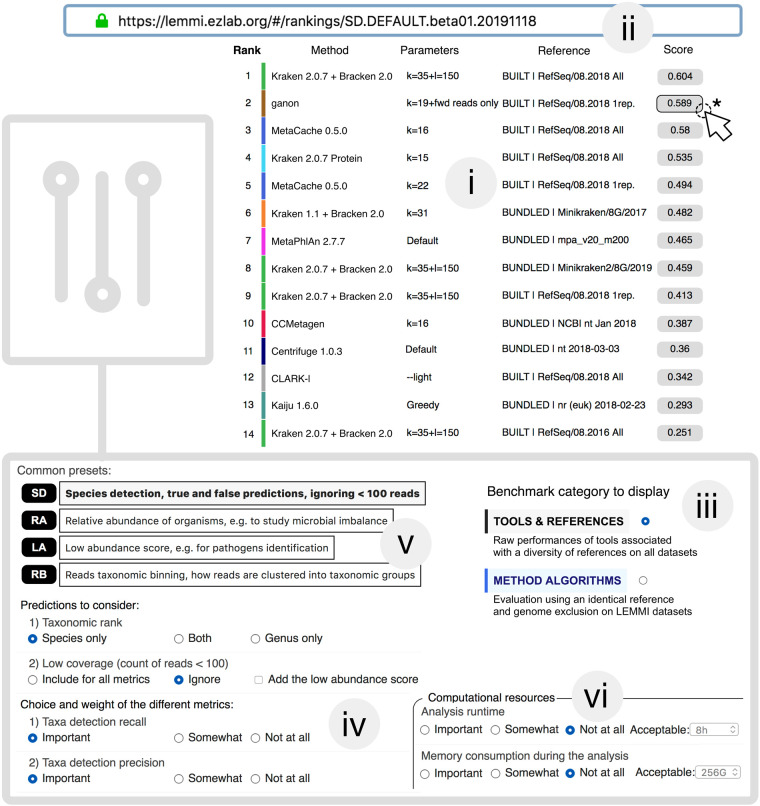
Figure 2.
LEMMI web interface. (i) The LEMMI users obtain a list of entries suited to their needs through the dynamic ranking interface that allows them to select and weight the criteria of interest. The ranking visible here shows the performances when identifying species while ignoring taxa under 100 reads, balancing precision and recall. The score assigned to each entry visible in LEMMI rankings averages selected metrics over all tested data sets. Underlying values can be seen by clicking on the score (*). (ii) A unique “fingerprint” allows custom rankings to be shared and restored at any time on the LEMMI platform through the address bar. (iii) The benchmark category can be selected in the dashboard. (iv) Prediction accuracy metrics can be chosen along with their importance (weight for “Important” is 3, “Somewhat” is 1, and “Not at all” is 0). This will cause the list to be updated with the corresponding scores. (v) Several presets corresponding to common expectations are available. (vi) Computational resources and the time required to complete the analysis can be included as an additional factor to rank the methods.

