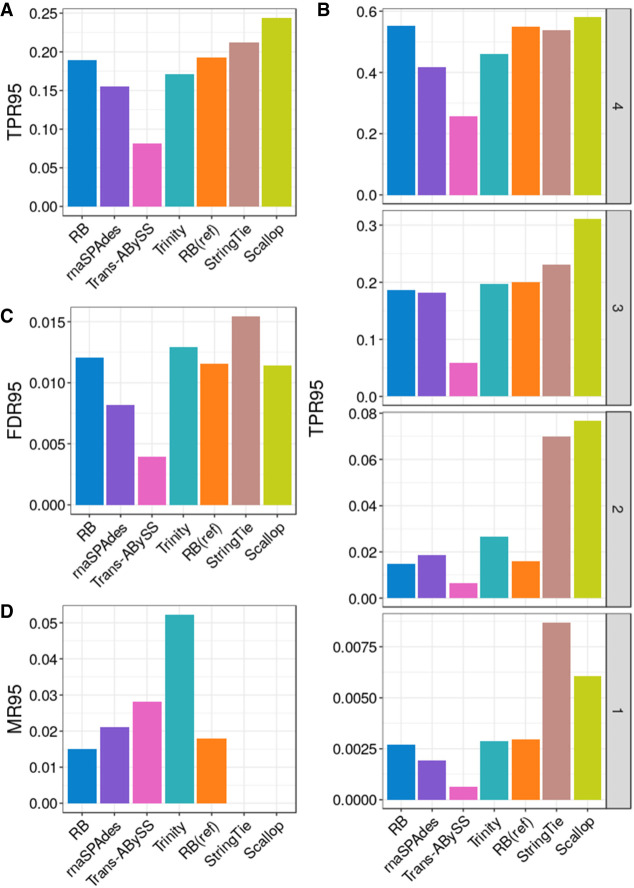
Figure 1.
Assembly quality on mouse simulated bulk RNA-seq data. (A) True positive rate calculated based on I95, denoted as TPR95. (B) True positive rate at four transcript expression strata. Isoforms in strata 1, 2, 3, and 4 have nonzero values of transcripts per million (TPM) in the lowest quartile, second-lowest quartile, second-highest quartile, and the highest quartile, respectively. (C) False-discovery rate calculated based on I95, denoted as FDR95. (D) Misassembly rate calculated based on I95, denoted as MR95.

