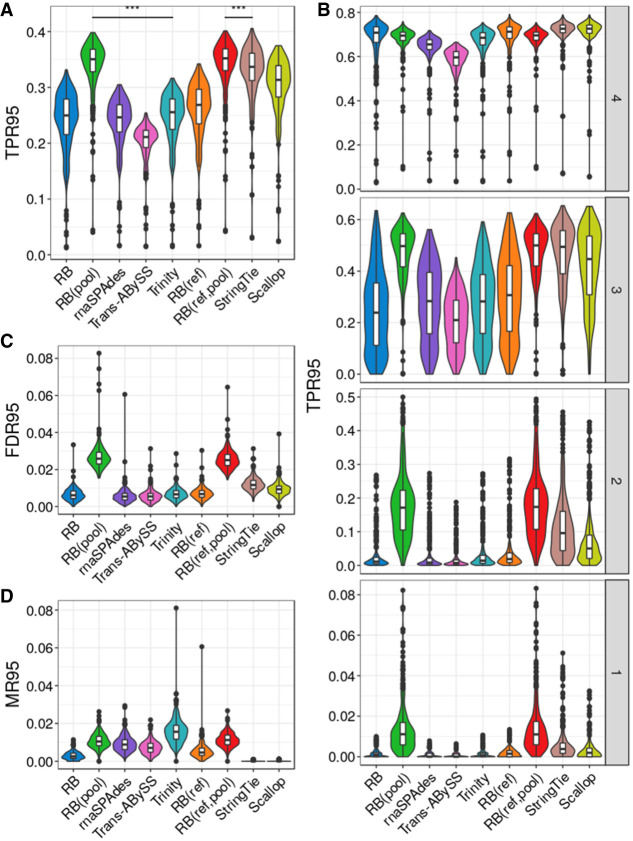
Figure 3.
Assembly quality on simulated data for 384 mouse cells. (A) True positive rate calculated based on isoforms reconstructed to at least 95% of annotated length, denoted as TPR95. (B) True positive rate at different transcript expression stratum. (C) False-discovery rate calculated based on isoforms reconstructed to at least 95% of annotated length, denoted as FDR95. (D) Misassembly rate calculated based on isoforms reconstructed to at least 95% of annotated length, denoted as MR95. Distributions of each metric were measured over all 384 cells. The comparison bars on top between RB(pool) and RB(ref,pool) and the next best performer in each class indicate statistical significance of the difference between distributions at P < 0.001 (***) or no significance (NS) using the Wilcoxon test.

