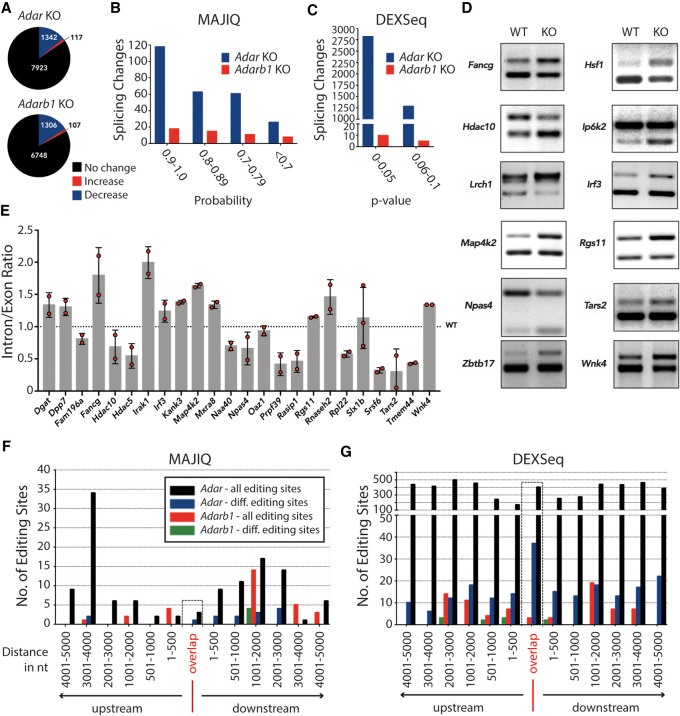
Figure 1.
ADAR or ADARB1 deficiency causes transcriptome-wide changes in splicing patterns. (A) Pie charts depicting differential editing analysis in Adar- or Adarb1-deficient cortex. Editing levels remain steady (black), increase (red), or decrease (blue). (B) Histogram showing local splicing variations (LSVs) identified by MAJIQ tool in ADAR (Adar-) or Adarb1-deficient cortex binned by MAJIQ probability score. (C) Histogram showing differential exon/intron usage events identified by DEXSeq in Adar- or Adarb1-deficient cortex binned by DEXSeq adjusted P-value. (D) RT-PCR validation of LSVs predicted by MAJIQ in Adar-deficient cortex resolved by agarose gel electrophoresis. (E) qPCR validation of LSVs predicted by MAJIQ in Adar-deficient cortex. Data shown are the mean inclusion to exclusion ratio in Adar KO (±SD). (F) Histogram showing ADAR and ADARB1 differential editing sites found in the indicated distances of ADAR- and ADARB1-dependent LSV events identified by MAJIQ in the cortex; editing sites are binned (±5 kb) by significant chromosomal coordinates. Editing sites that lie exactly on/within the differentially spliced regions have been highlighted and binned as “Overlap.” Only those editing sites that were found in the ±5-kb window have been plotted. (G) Histogram showing ADAR and ADARB1 differential editing sites identified in the indicated distances of ADAR- and ADARB1-dependent differential exon/intron usage identified in the cortex; editing sites are binned (±5 kb) by significant chromosomal coordinates. Editing sites that lie exactly on/within the differentially spliced regions have been highlighted and binned as “Overlap.” Only those editing sites that were found in the ±5-kb window have been plotted.

