Figure 2.
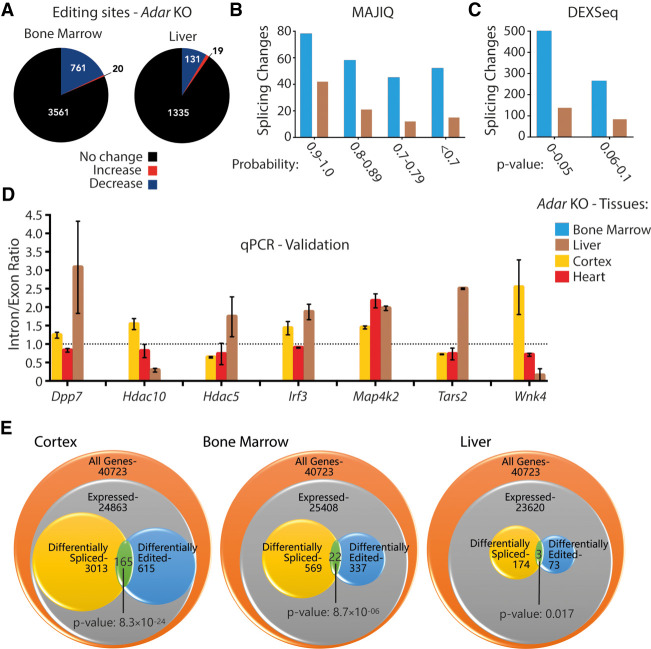
ADAR-dependent splicing changes are tissue-specific. (A) Pie charts depicting the differential editing analysis in Adar-deficient bone marrow and liver. Editing levels remain steady (black), increase (red), or decrease (blue). (B) Histogram showing local splicing variations identified by MAJIQ in Adar-deficient bone marrow (blue) and liver (brown) binned by the MAJIQ probability score. (C) Histogram showing differential exon/intron usage events identified by DEXSeq in Adar-deficient bone marrow (blue) and liver (brown) binned by the DEXSeq adjusted P-value. (D) Histogram showing inclusion/exclusion ratios (liver: brown, cortex: yellow, heart: red) validated by qPCR of MAJIQ events (n = 2 or 3). Data shown are the mean inclusion to exclusion ratio in Adar KO (±SD). (E) GeneOverlap analysis of the number of genes expressed per tissue, those that show differential editing, and those that show differential splicing. The overlap between the latter two categories is higher than stochastically expected, suggesting that editing and splicing are mechanistically linked.

