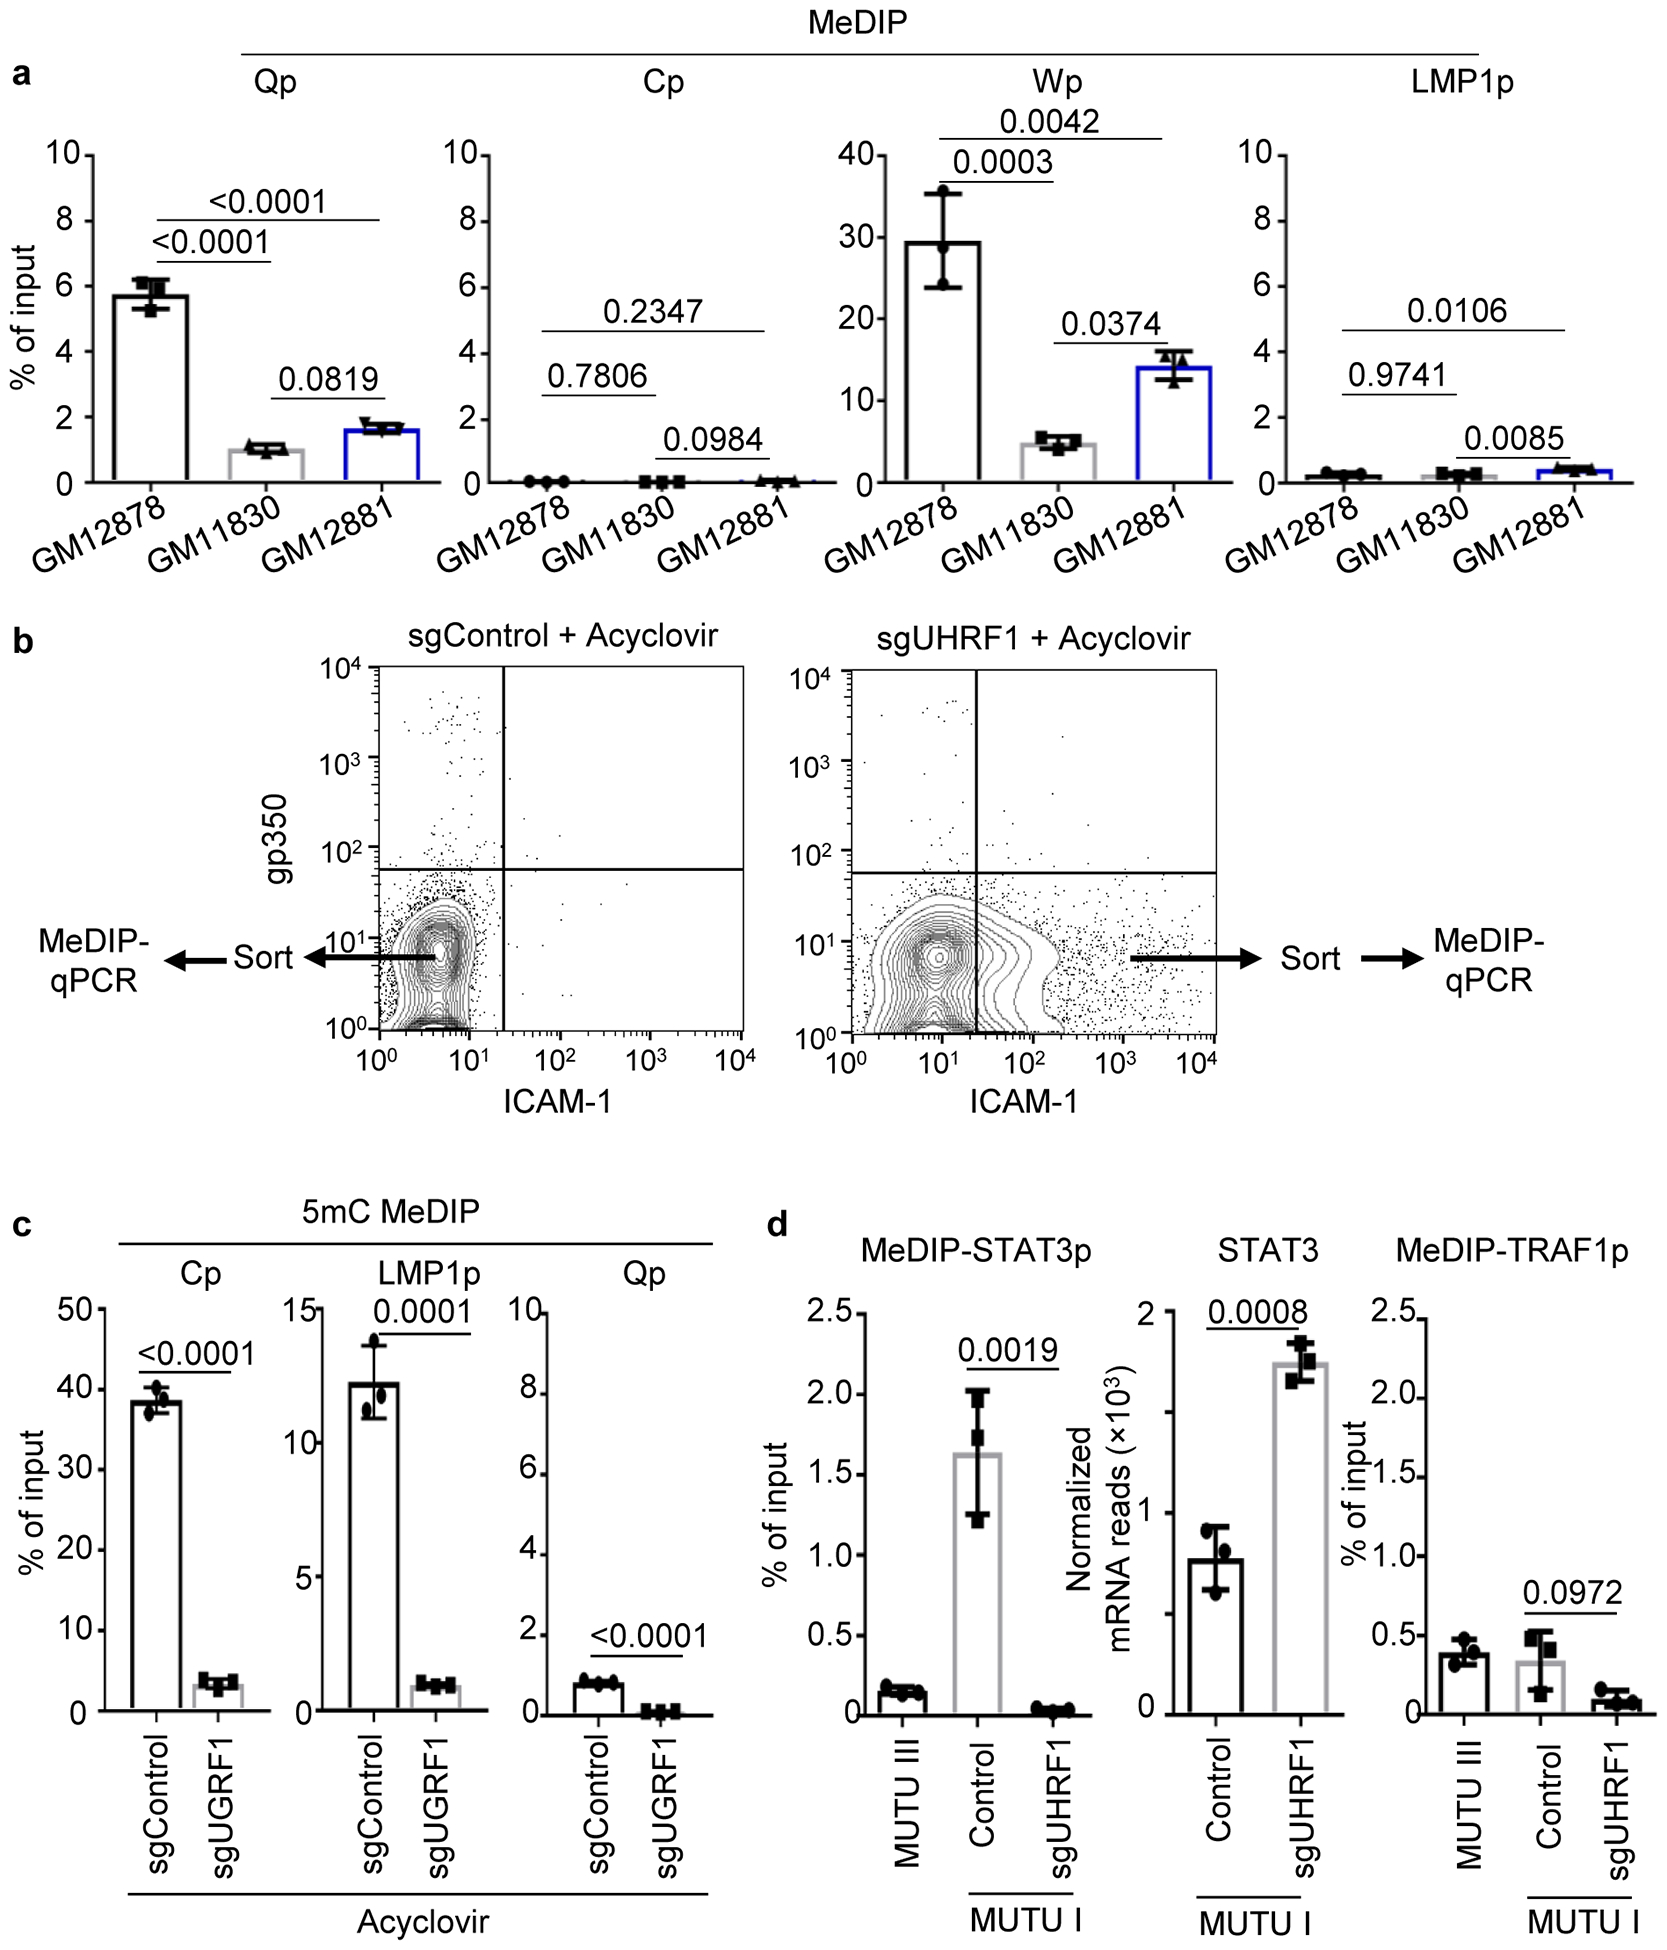
Extended Data Fig. 5. MeDIP analysis of promoter CpG methylation in LCLs or in CRISPR edited BL treated with acyclovir.

a. 5 mC MeDIP was performed on DNA from GM12878 (black bars), GM11830 (gray bars) or GM12881 LCLs (blue bars) followed by qPCR for the Qp, Cp, Wp or LMP1p. Mean ± SEM for n=3 of biologically independent replicates are shown. p-values were calculated using two-way ANOVA with Turkey’s multiple comparisons test.
b, FACS plots of PM gp350 and ICAM-1 abundances in MUTU I cells that expressed the indicated sgRNAs and that were treated with acyclovir (50 μg/ml) to block new EBV genome synthesis by the viral polymerase. The indicated populations from sgControl versus sgUHRF1 expressing cells were sorted and used for 5 mC MeDIP-qPCR analysis. n=3 biologically independent experiments.
c, 5 mC MeDIP was performed on chromatin from sorted sgControl (black bars) or sgUHRF1 (gray bars) followed by qPCR for Cp, Wp or Qp. Mean ± SEM for n=3 biologically independent replicates are shown. p-values were calculated by unpaired two-sided student’s t-test with equal variance assumption.
d, 5 mC MeDIP was performed on chromatin from sorted sgControl (black bars) or sgUHRF1 (gray bars) followed by qPCR for the host STAT3 or TRAF1 promoters (n=3 of biologically independent experiments). Shown also are normalized mRNA reads from n=3 of biologically independent RNAseq datasets of MUTU I expressing control or UHRF1 sgRNAs. p-values were calculated by unpaired two-sided student’s t-test with equal variance assumption.
