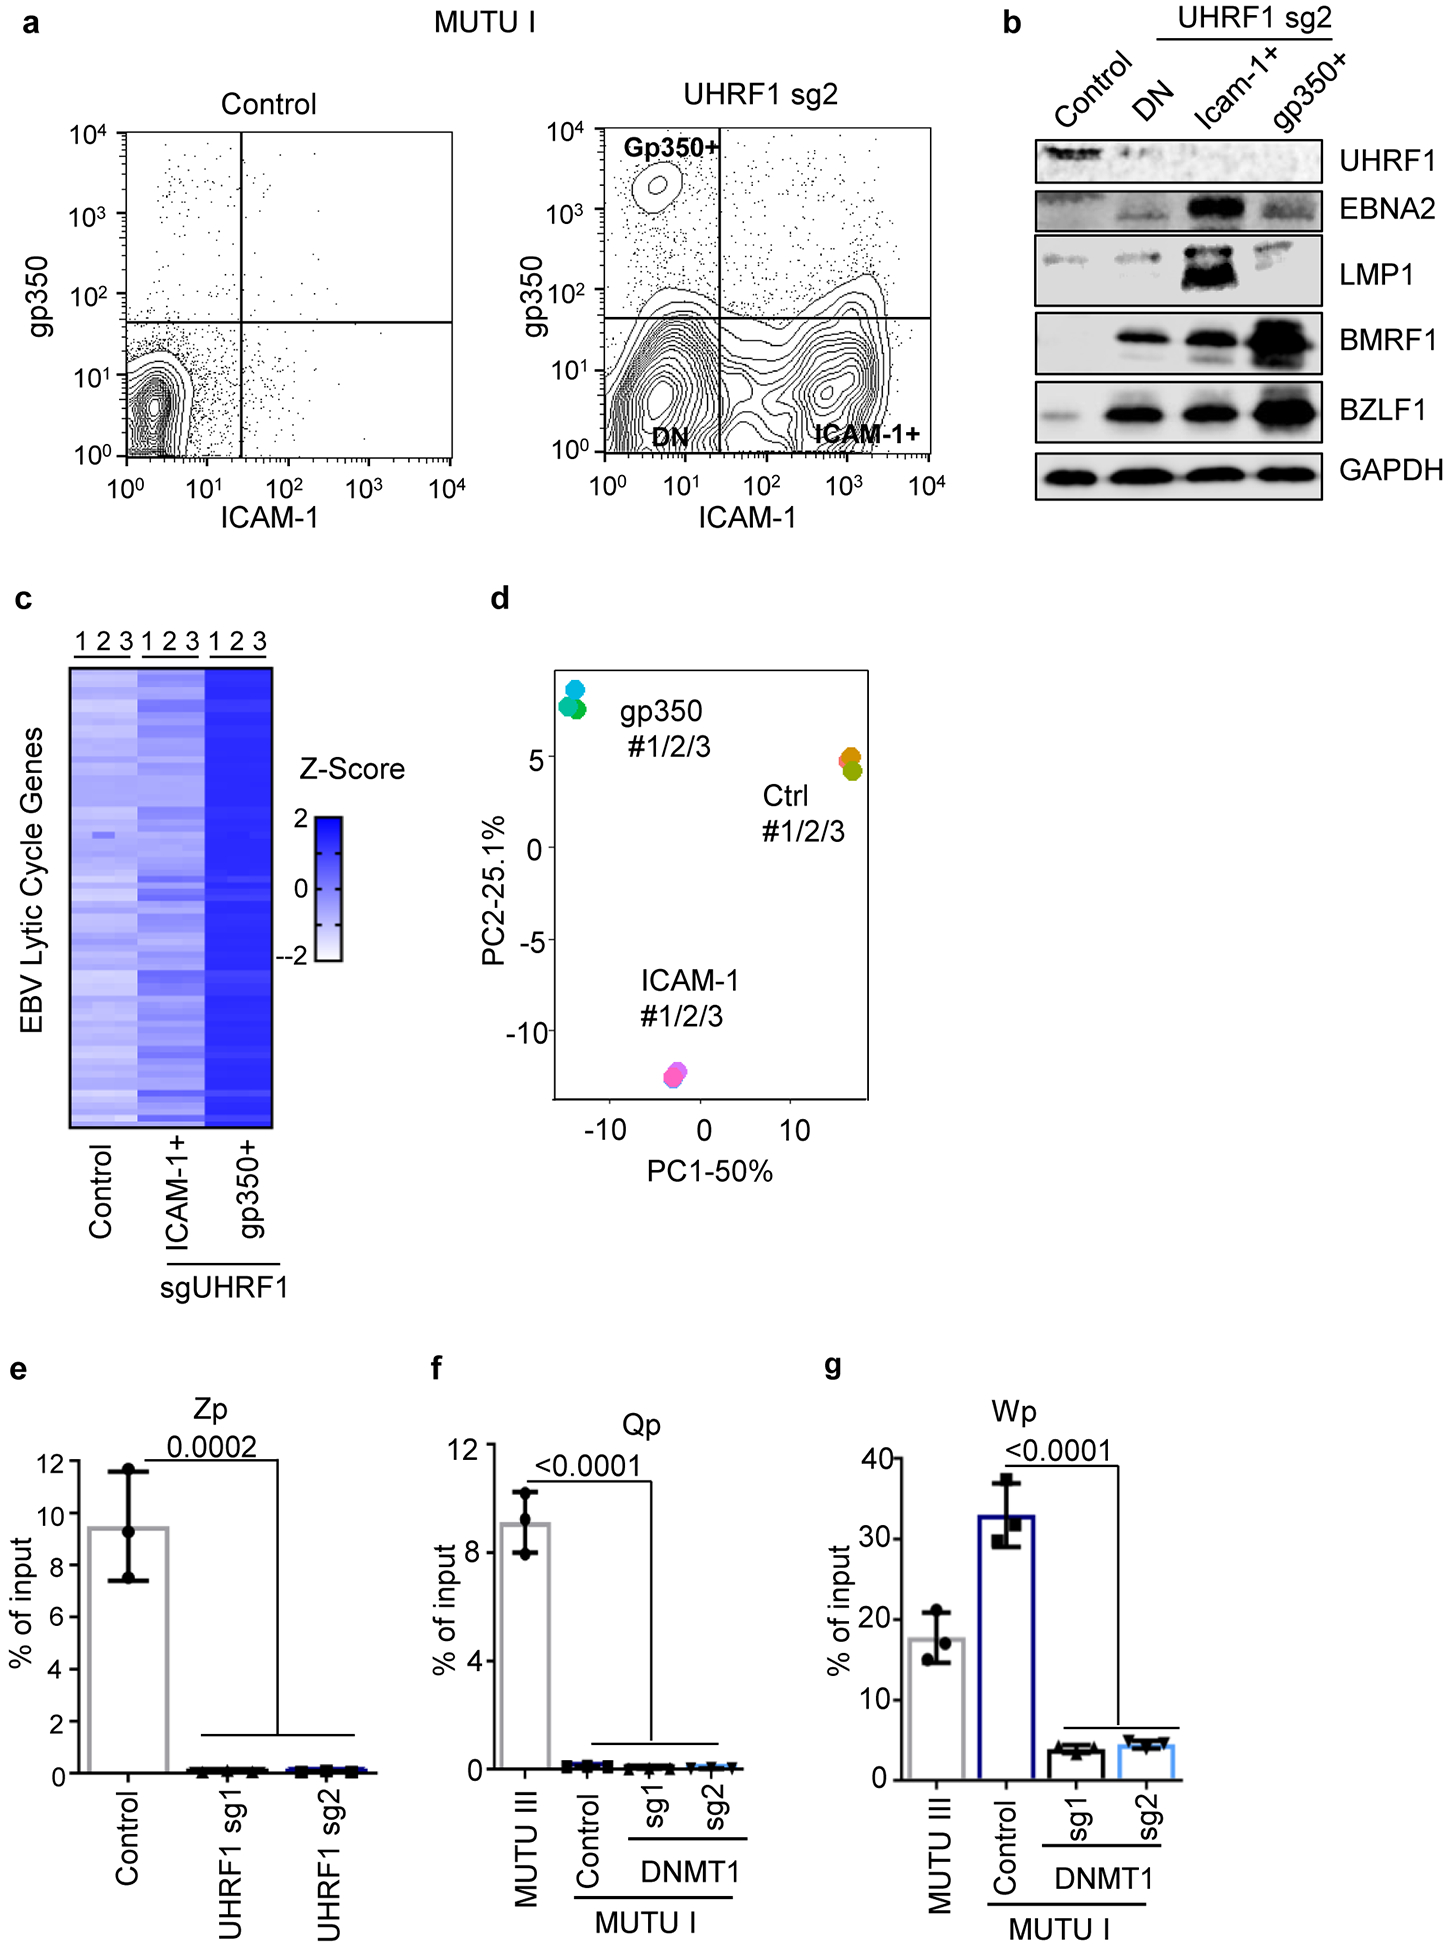
Extended Data Fig. 6. UHRF1 depletion induced lytic reactivation in a small percentage of cells.

a, FACS analysis of ICAM-1 and gp350 plasma membrane abundances in MUTU I cells with control or UHRF1 sgRNAs. DN = double negative. Plots are representative of n=3 biologically independent replicates.
b, Immunoblot analysis of WCL from the indicated populations of FACSorted MUTU I cells, representative of n=3 biologically independent replicates.
c, Heatmap of EBV gene expression in the indicated FACSorted MUTU I populations. Heatmap values displace Z-score values of mRNAs of EBV lytic genes, which describe the standard deviation variation from the mean value of each gene. Individual data from n=3 biologically independent samples are shown.
d, Principal component (PC) analysis of mRNA expression in sorted MUTU I populations. RNAseq of n=3 biologically independent replicates was performed.
e-g 5 mC MeDIP was performed on chromatin isolated from MUTU I cells followed by qPCR using primers specific for Zp (e), Qp (f), or Wp (g). Mean ± SEM are shown for n=3 biologically independent replicates. p-values were calculated using one-way ANOVA with Sidak’s multiple comparisons test.
