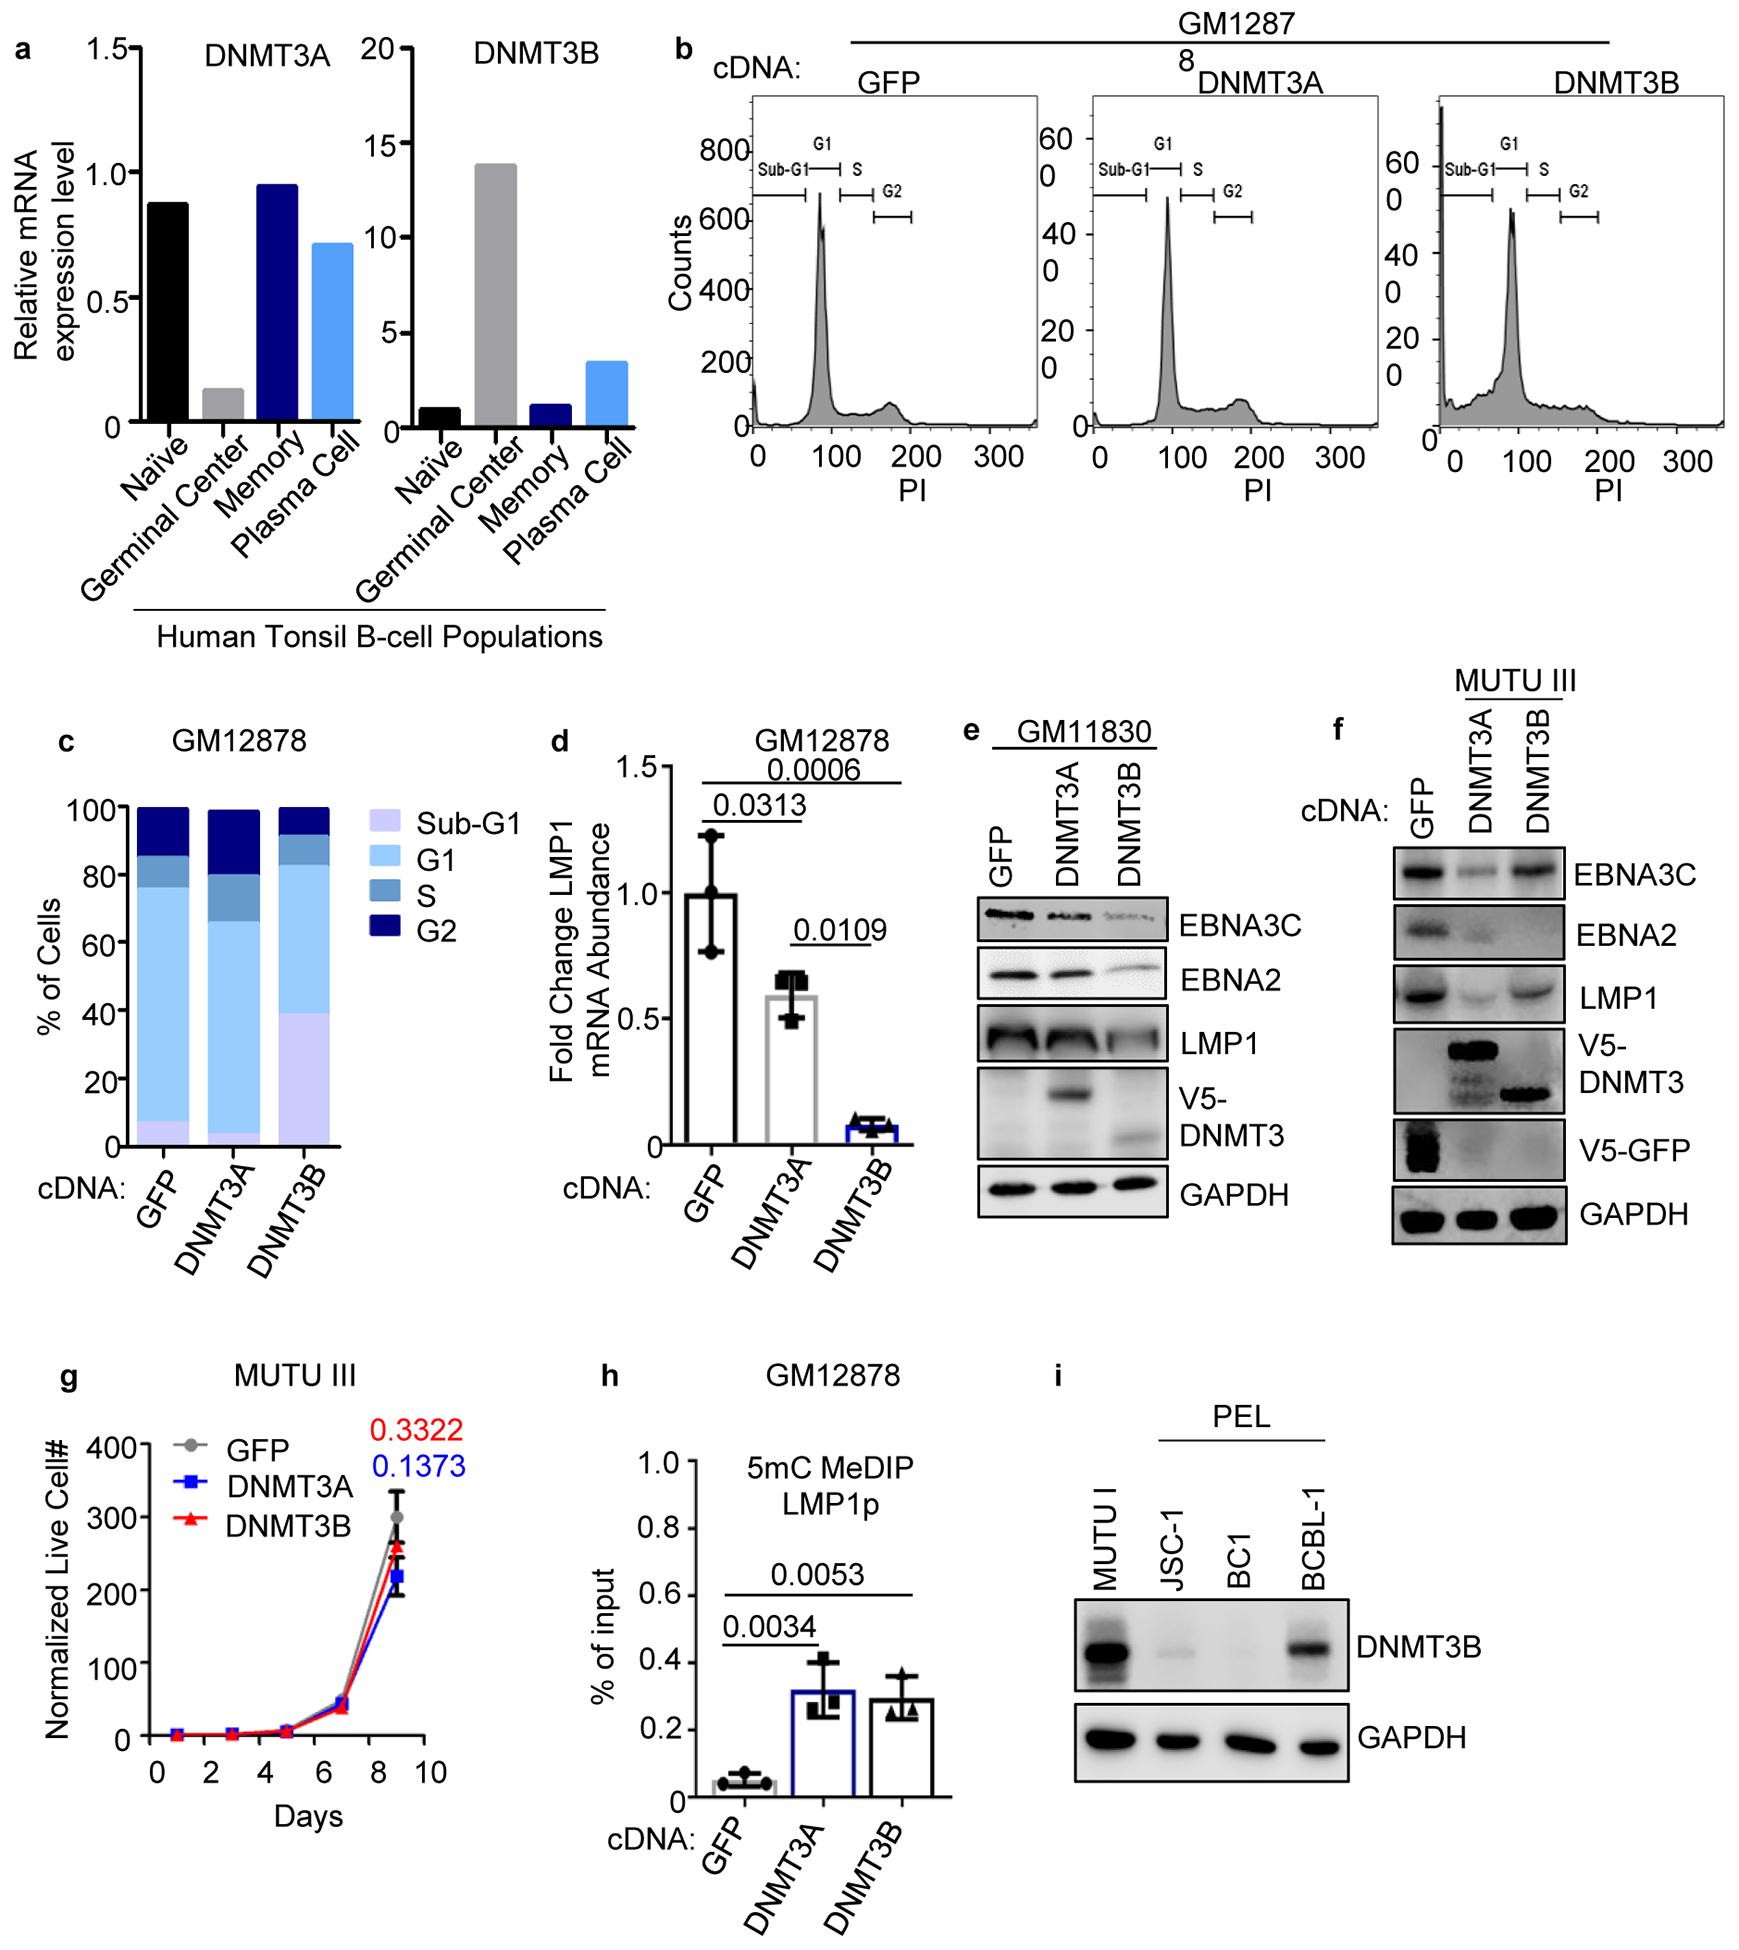
Extended Data Fig. 8. Initiator DNA methyltransferase expression in human tonsil B-cell subsets and overexpression effects on LCL growth and survival.

a. DNMT3A and 3B mRNA expression in published microarray analysis of human tonsil B-cell naïve, GC, memory or plasma cell subsets53.
b, Propidium iodide (PI) cell cycle analysis of GM12878 LCLs that expressed control GFP, DNMT3A or DNMT3B. Data are representative of n=2 biologically independent replicates.
c, Percentages of the indicated cell populations in GM12878 that expressed GFP, DNMT3A or DNMT3B. Data are the average of n=2 biologically independent replicates.
d, qPCR analysis of LMP1 mRNA abundances in GM12878 that expressed the indicated GFP, DNMT3A or DNMT3B cDNAs. Mean ± SEM from n=3 biologically independent replicates are shown. p-values were calculated using one-way ANOVA with Turkey’s multiple comparisons test.
e, Immunoblot analysis of WCL from GM11380 LCLs that expressed GFP, DNMT3A or DNMT3B cDNAs, as indicated.
f, Immunoblot analysis of WCL from MUTU III that expressed GFP, DNMT3A or DNMT3B cDNAs.
g, Normalized MUTU III live cell numbers at the indicated timepoints after expression of GFP, DNMT3A or DNMT3B. Mean ± SEM from n=3 biologically independent replicates are shown. p-values were calculated by two-sided student’s t-test with equal variance assumption.
h, 5 mC MeDIP analysis of chromatin from GM12878 expressing GFP (gray box), DNMT3A (blue box) or DNMT3B (black box) followed by qPCR using a second primer set specific for LMP1p (from the same experiment as in Fig. 4f). Mean ± SEM are shown for n=3 biologically independent replicates. p-values were calculated using two-way ANOVA with Sidak’s multiple comparisons test.
i, Immunoblot analysis of WCL from MUTU I, from the EBV+/KSHV+ PELs JSC-1 or BC-1, or from the EBV-/KSHV+ PEL BCBL-1.
Blots in e, f, and i are representative of n=3 biologically independent replicates.
