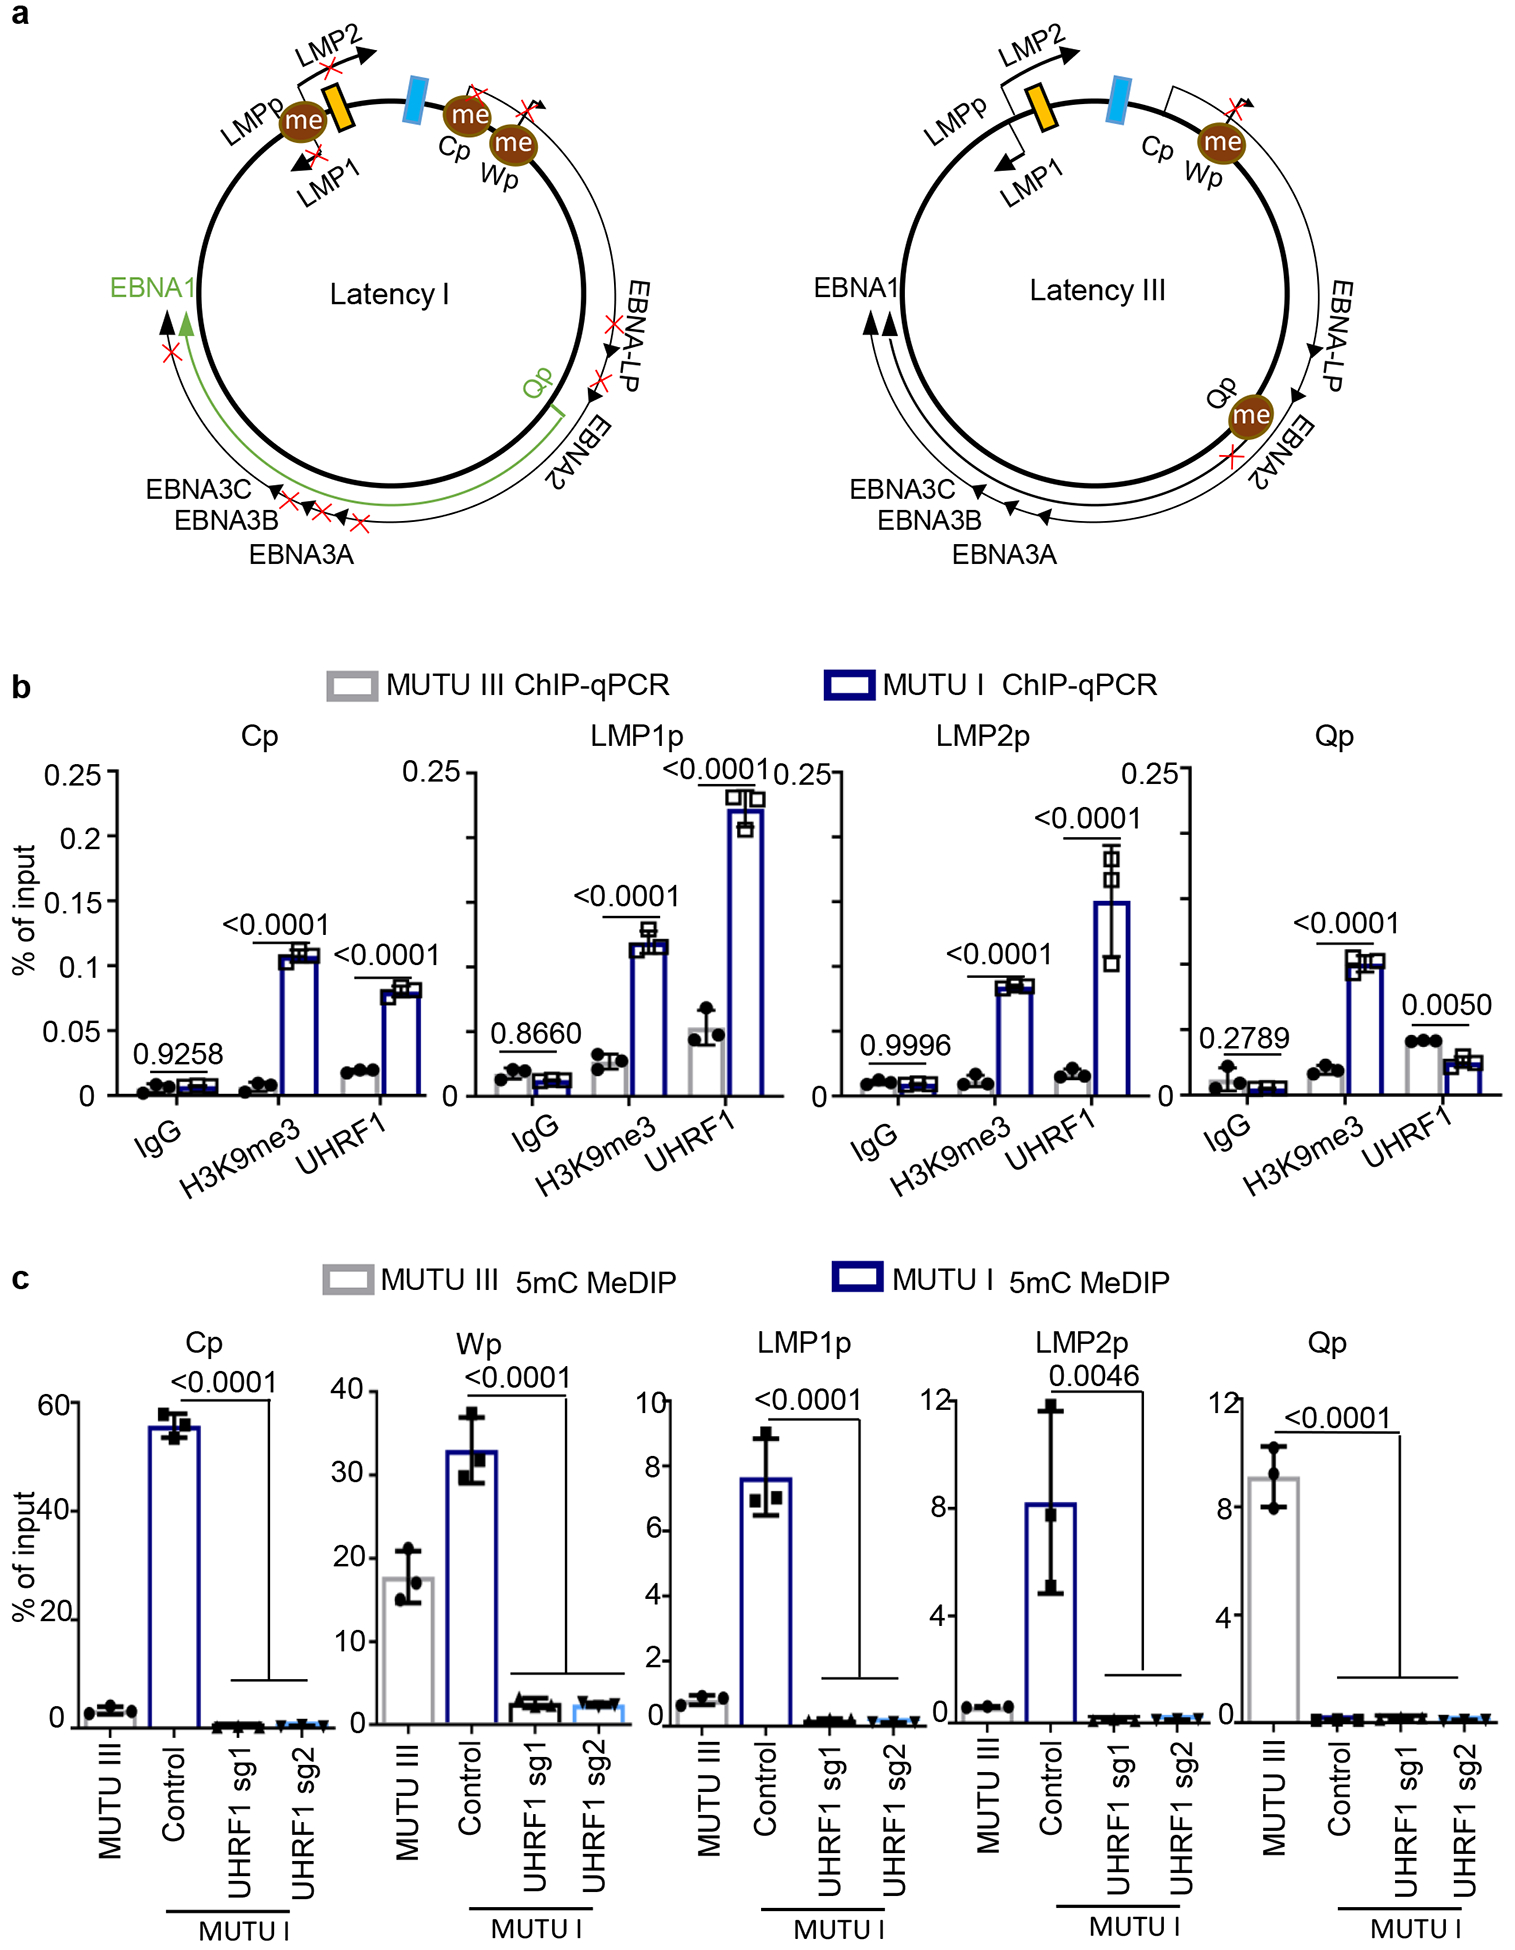
Fig 3. UHRF1 maintains EBV latency promotor methylation.

a, Schematic diagram of EBV latency Cp, Wp and Qp promotor usage in latency I (left) versus latency III (right). Brown circle indicates DNA CpG methylation, red “x” indicates epigenetically blocked transcription.
b, ChIP for UHRF1 or H3K9me3 was performed on chromatin from MUTU I (blue columns) or MUTU III (gray columns) followed by qPCR with primers specific for Cp, LMP1p, LMP2p or Qp. Mean ± SEM are shown for n=3 biologically independent replicates are shown. p-values were calculated by two-way ANOVA with Sidak’s multiple comparisons test.
c, MeDIP was performed on DNA from MUTU III (gray bars) or in MUTU I (blue bars) that expressed control or independent UHRF1 sgRNAs followed by qPCR with primers specific for Cp, Wp, LMP1p, LMP2p or Qp. Mean ± SEM for n=3 biologically independent replicates are shown. p-values were calculated using one-way ANOVA with Sidak’s multiple comparisons test.
