
Extended Data Fig. 1. Genome-wide CRISPR-Cas9 Mediated Loss-of-Function Screen Identifies UHRF1 and DNMT1 as candidate regulators of EBV Latency III.
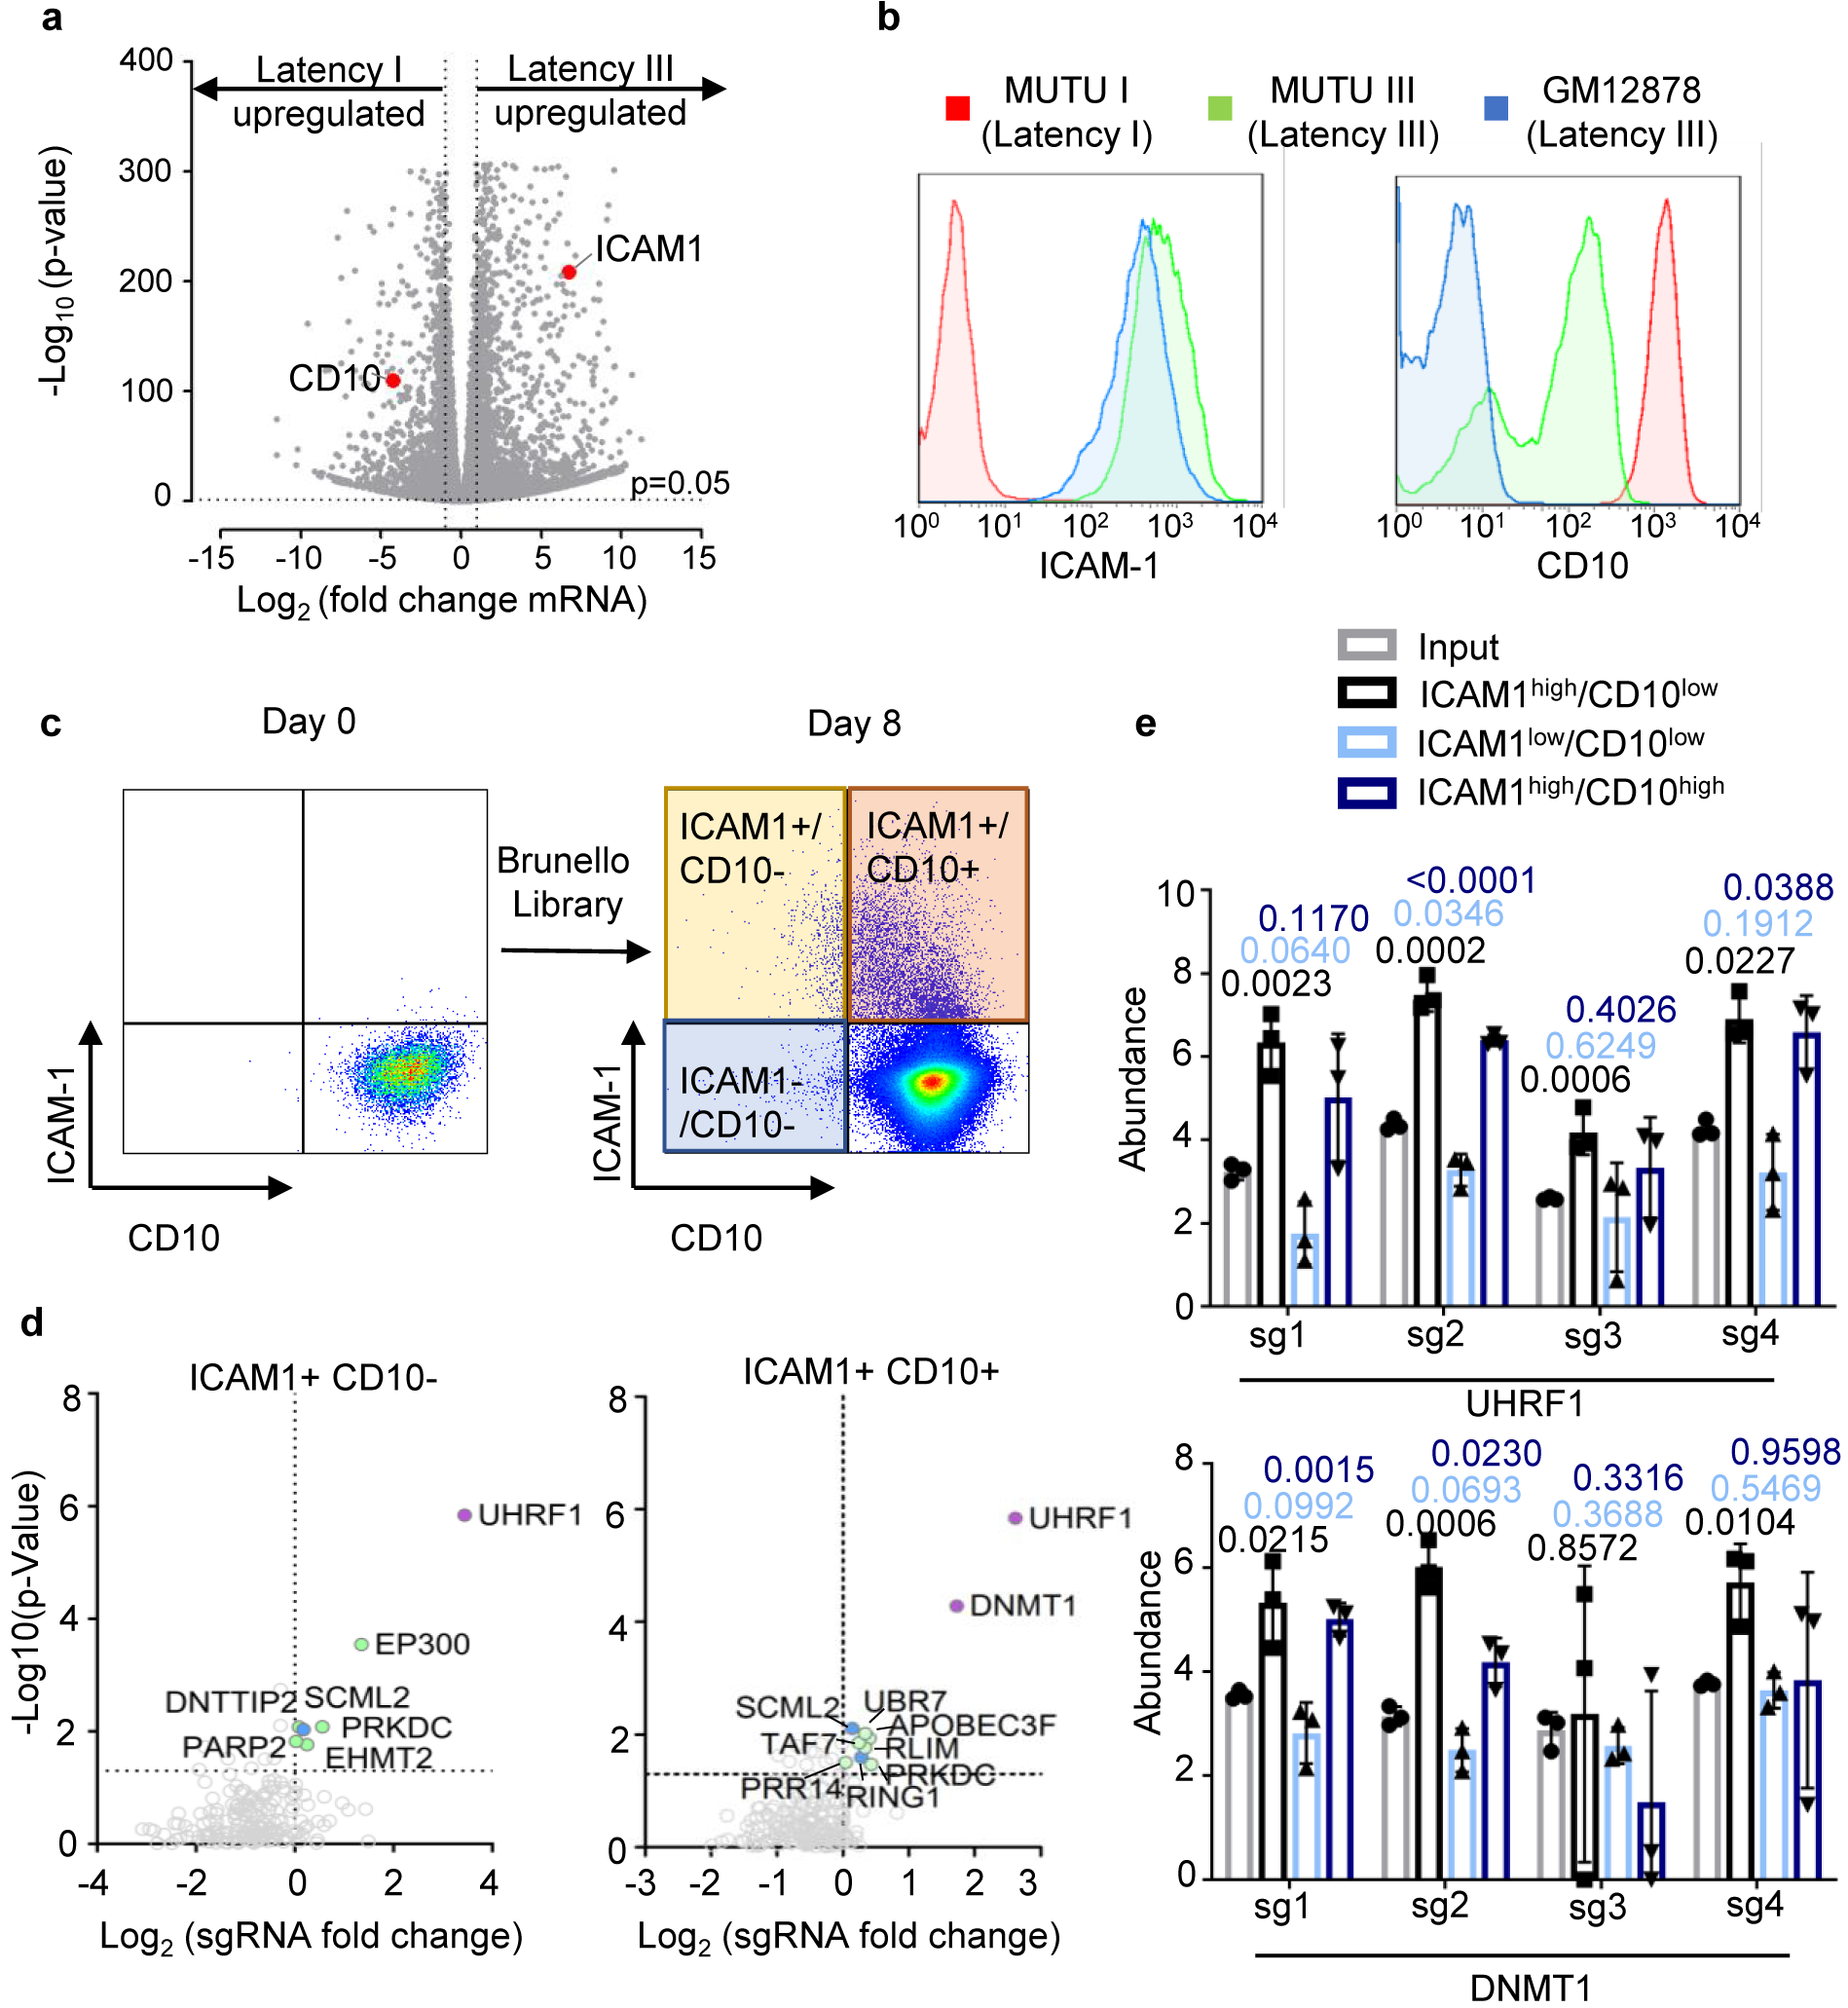
a, Volcano plot visualization of -Log10(p-value) statistical significance (y-axis) and Log2 fold-change in mRNA abundance (x-axis) of MUTU III versus MUTU I cells from triplicate RNA-seq datasets. ICAM-1 and CD10 (encoded by MME) are highlighted by red dots. n=3 biologically independent replicates. P-value and log fold change were generated with DESeq under default settings with Wald test and normal shrinkage, respectively
b, Plasma membrane ICAM-1 (left) and CD10 (right) abundances in MUTU1 (red), MUTU III (green) and GM12878 LCLs. Plots are representative of n=3 biologically independent values.
c, FACS plots of plasma membrane ICAM-1 and CD10 abundances in MUTU I cells prior to and at 8 days following transduction by the Brunello sgRNA library. Transduced cells were puromycin selected two days post-transduction. Plots are representative of n=3 biologically independent values.
d, Volcano plot of CRISPR screen results for genes encoding host epigenetic factors in the ICAM-1high/CD10low and ICAM-1high/CD10high subpopulations, using the curated EpiFactors database69. Plots are representative of n=3 biologically independent values. P-values were determined by one-sided Fisher’s exact test.
e, Log2-normalized abundance of the four Brunello library sgRNAs targeting UHRF1 or DNMT1 in the input (pre-FACSort) library (gray), ICAM-1high/CD10 low population (black), ICAM-low/CD10low (light blue), and ICAM-1high/CD10high (dark blue). Significance between the input and FACSorted groups was assessed using the two-sided unpaired Student’s t test. Mean + SD from n=3 biologically independent screens is shown.