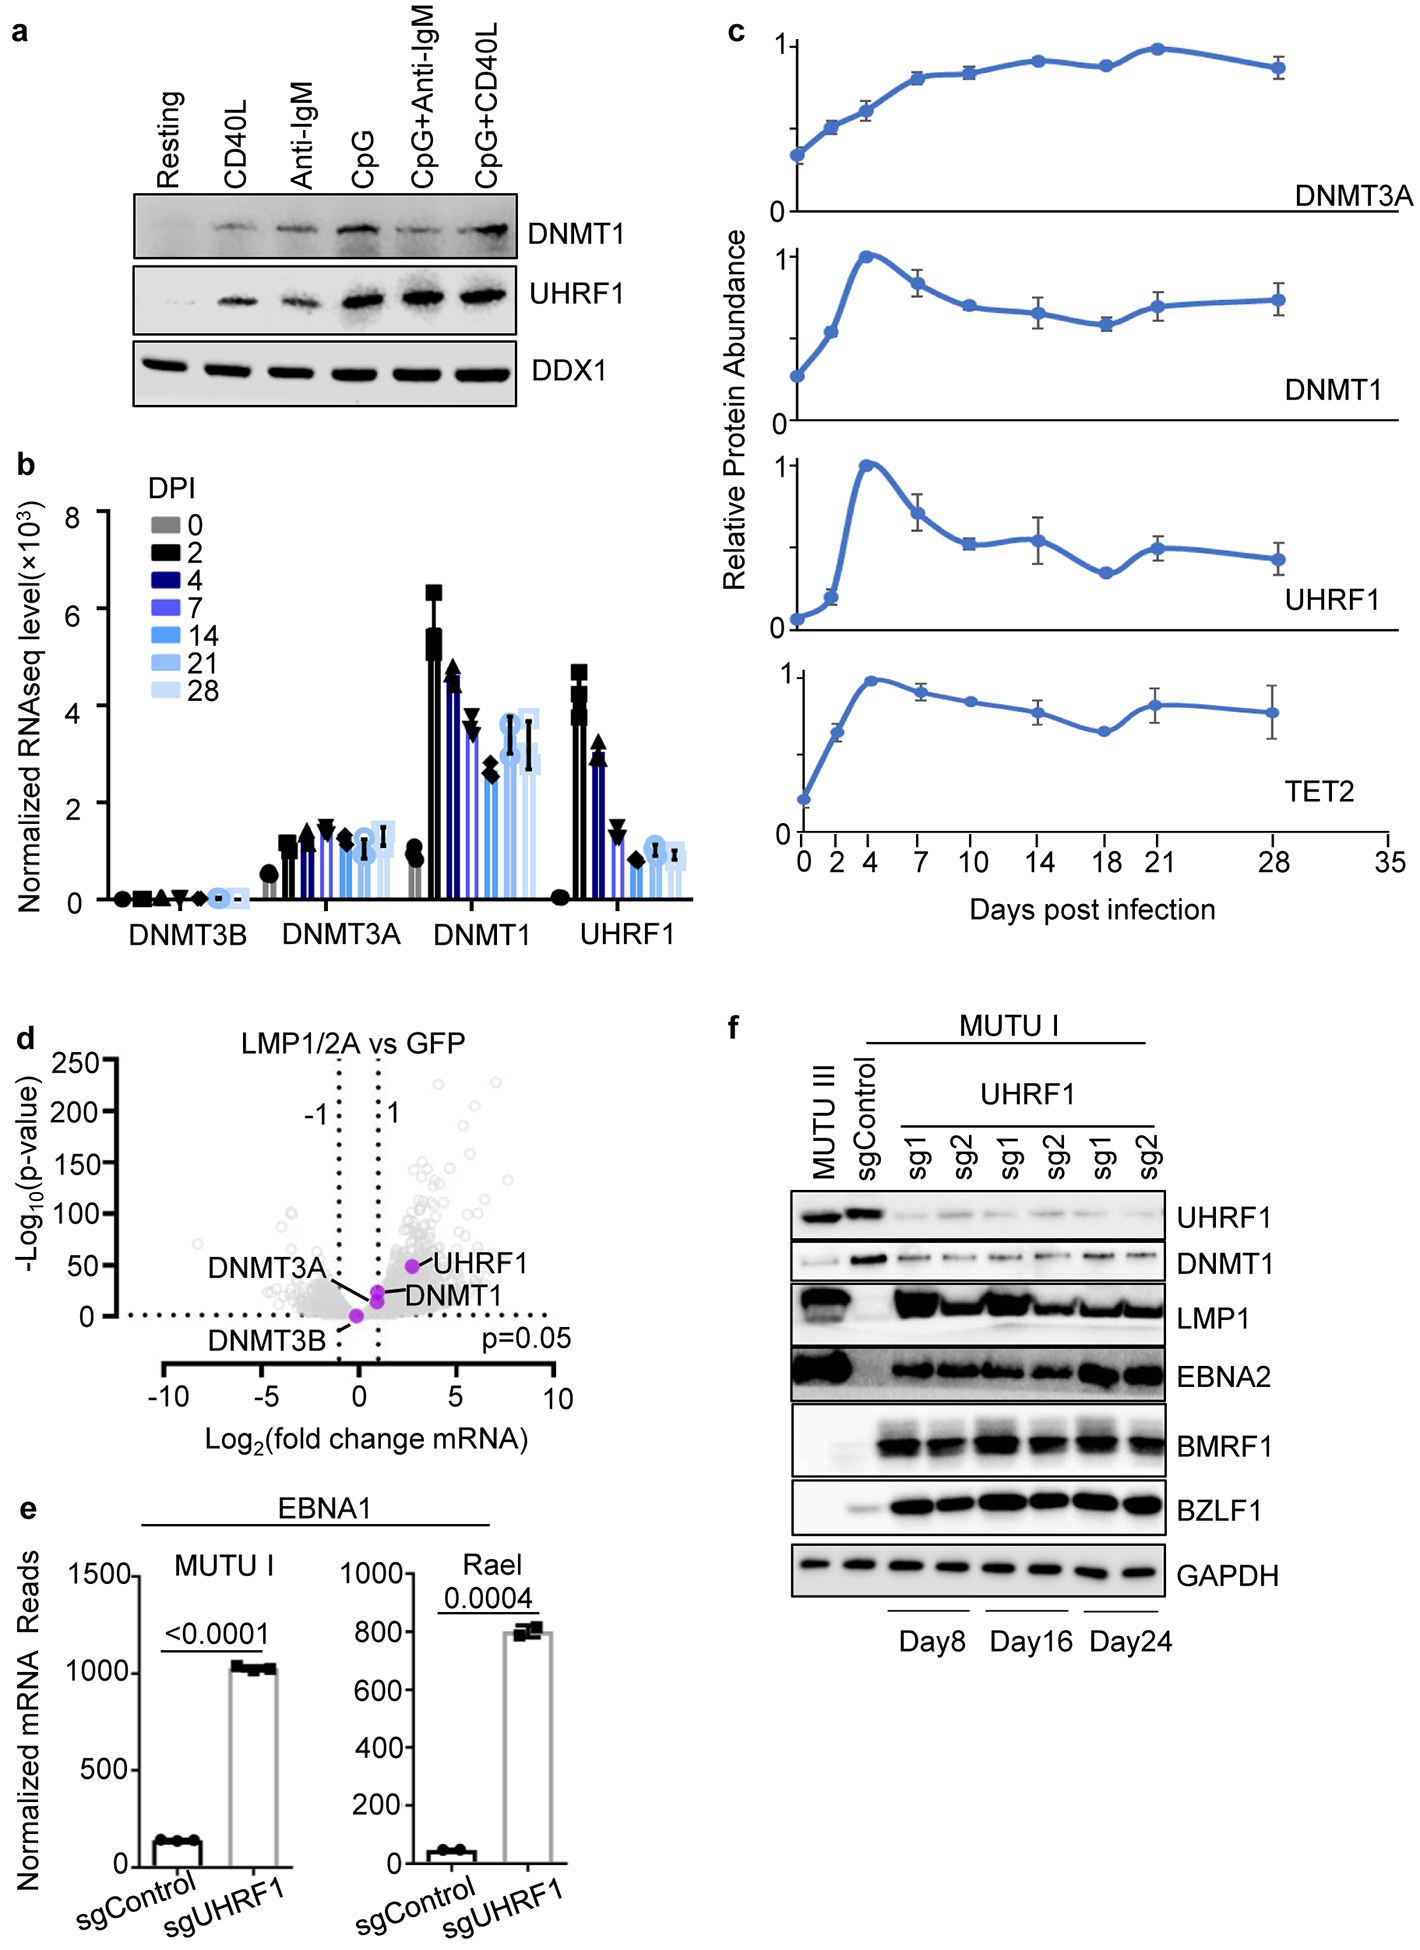
Extended Data Fig. 2. Dynamic primary B-cell UHRF1 and DNMT1 regulation by physiological or EBV stimuli.

a, Immunoblot of WCL from peripheral blood primary human B-cells that were resting or that were stimulated by Mega-CD40L (50 ng/ml), anti-IgM (1 μg/ml), CpG (0.5 μM), IgM+ CpG or CD40 + CpG for 24 hours.
b, Normalized DNMT3B, DNMT3A, DNMT1 or UHRF1 mRNA levels in primary human peripheral blood B-cells at the indicated day post infection (DPI) by the EBV B95.8 strain32. Shown are the mean + SEM values from n=3 of biologically independent RNAseq datasets.
c, UHRF1, DNMT1, DNMT3A and TET2 relative protein abundances detected by tandem-mass-tag-based proteomics at rest and at nine time points after EBV B95.8 infection of primary human peripheral blood B-cells at a multiplicity of infection of 0.1. DNMT3B expression was not detected. Data represent the average +/− SEM for four independent replicates8. For each protein, the maximum level detected across the time course was set to a value of one.
d, Volcano plot visualization of -Log10 (p-value) statistical significance (y-axis) and Log2 fold-change in mRNA abundance (x-axis) of ex vivo GC B-cells that conditionally expressed control GFP or both LMP1 and LMP2A from an AICDA promoter, which is activated in GC B-cells. Data are from n=3 of biologically independent RNA-seq datasets34. P-value and log fold change were generated with DESeq under default settings with Wald test and Normal shrinkage, respectively. UHRF1, DNMT1, DNMT3A and DNMT3B values are highlighted.
e, Normalized EBNA1 mRNA reads from RNAseq analysis of MUTU I (n=3) or Rael cells (n=2) that expressed control or UHRF1 sgRNAs, as indicated. p-values were calculated by unpaired two-sided student’s t-test with equal variance assumption.
f, Immunoblot analysis of WCL from MUTU III or from MUTU I that expressed the indicated control or UHRF1 sgRNAs. Cells were harvested at the indicated day post sgRNA delivery by lentivirus transduction.
Blots in a and f are representative of n=3 biologically independent replicates.
