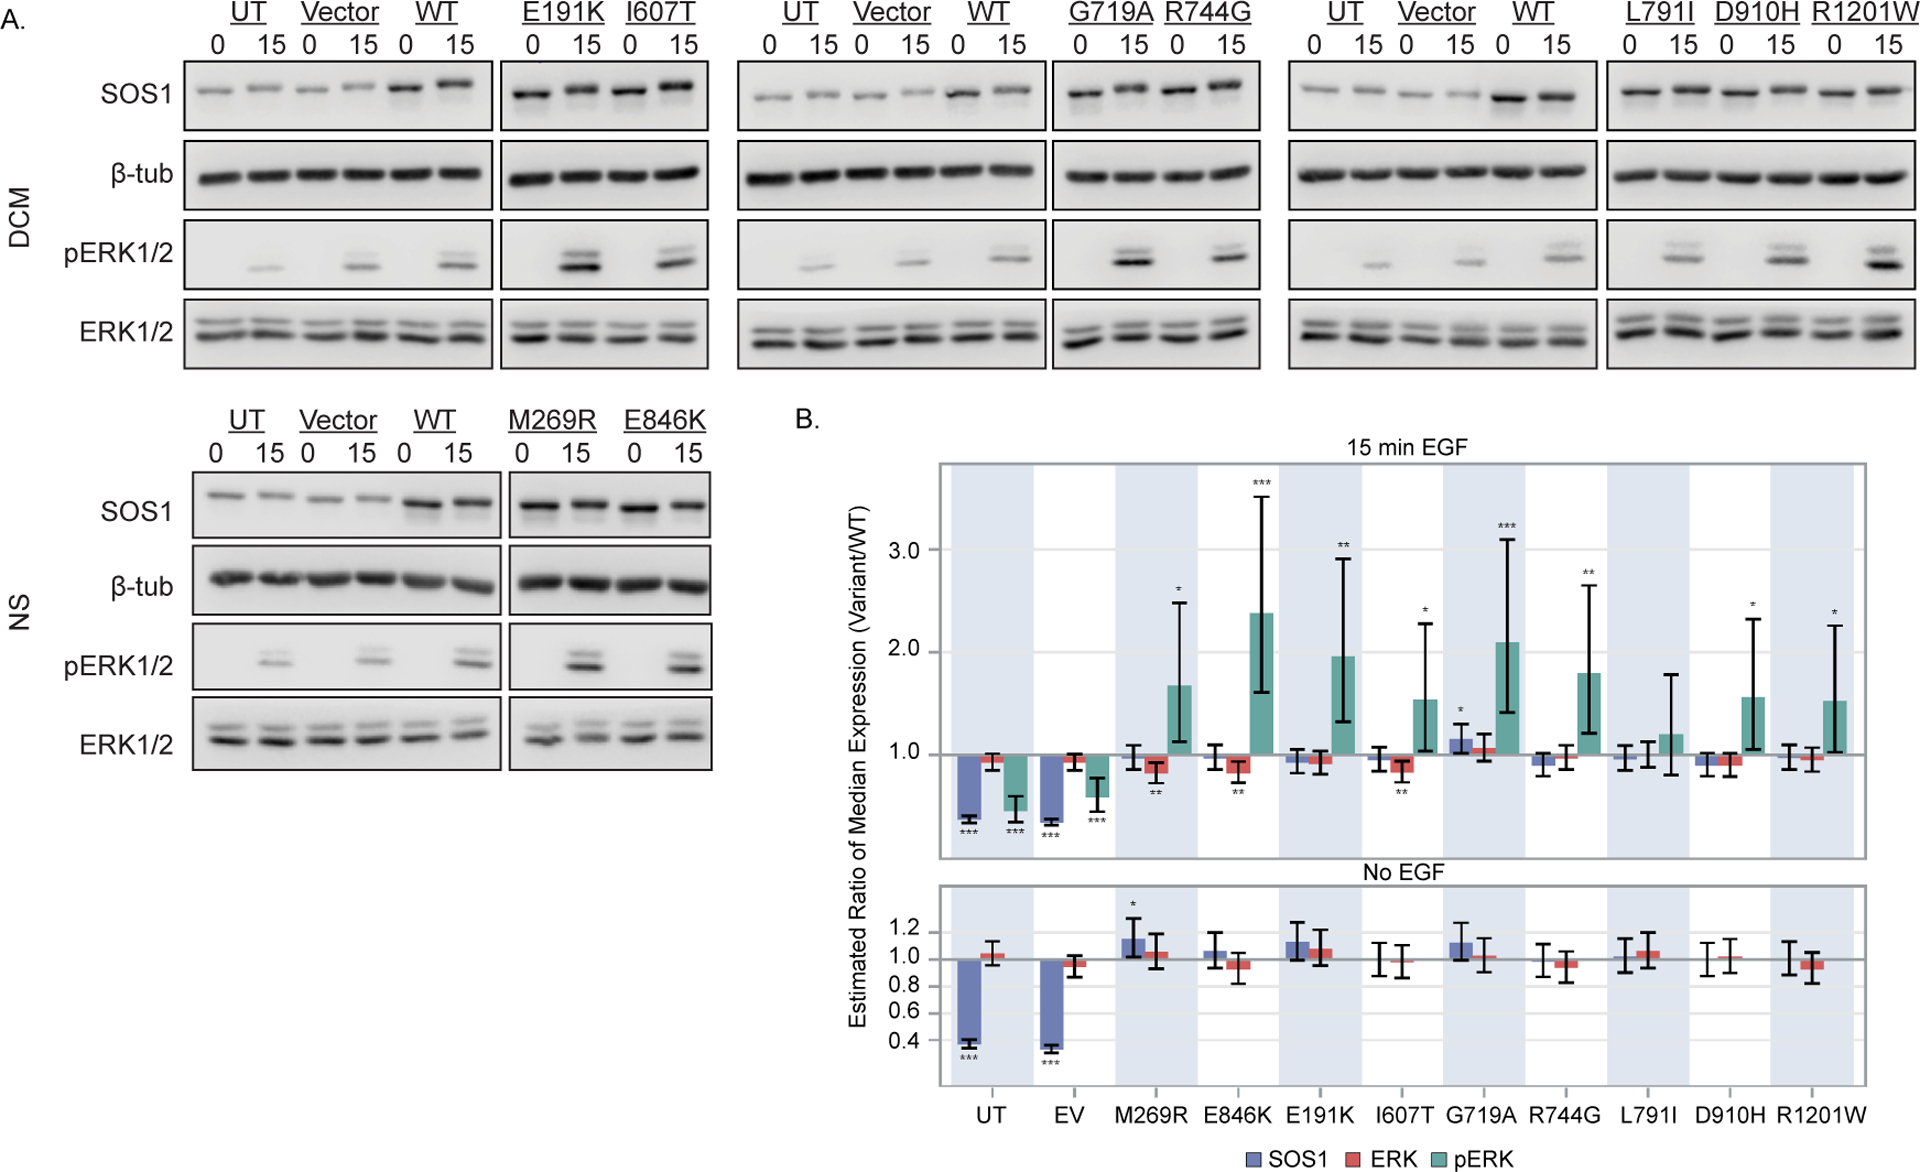
Figure 3.

DCM-associated SOS1 variants exhibit gain of function effects on MAPK/ERK signaling. HEK293T cells expressing variant or wild-type (WT) SOS1 were serum starved for 16 hours and alternatively stimulated for 15 minutes with epidermal growth factor (EGF) (15) or left unstimulated (0). (A) Representative immunoblots for each SOS1 variant are shown. Total protein isolates were probed using antibodies specific to phosphorylated ERK (pERK, Cell Signaling #4695, 1:5,000), total ERK (ERK, Cell Signaling #4370, 1:5,000) and SOS1 (Abcam ab140621, 1:10,000). Levels of β-tubulin were used to control for loading (Abcam, ab6046, 1:20,000). Note that pERK and total ERK levels were determined using separate blots generated from equal quantities of the same protein lysate. For figure clarity, SOS1 and β-tubulin are shown for only the pERK blot. Full blots can be found in Figure S3. (B) Differences in ERK activation between each variant and WT SOS1 are shown as estimated ratios of median protein expression (variant/WT) at baseline (no-EGF) and 15 min EGF stimulation. Bars represent point estimates of this ratio from a linear mixed model fit to data from three independent experimental replicates for each variant, and error bars represent pointwise 95% confidence intervals for this ratio. *, **, and *** denote two-sided p ≤ 0.05, 0.01, and 0.001, respectively, for the null hypothesis that this ratio was 1. Relative to WT SOS1, elevated pERK expression was observed for both NS-associated variants used as positive ERK activation controls (M269R, E846K), as well as for all six DCM-associated SOS1 variants. ERK activation for a suspected benign variant detected in our cohort (L791I) did not differ from WT. Differences in pERK expression were not attributable to changes in total ERK or SOS1 expression levels.
