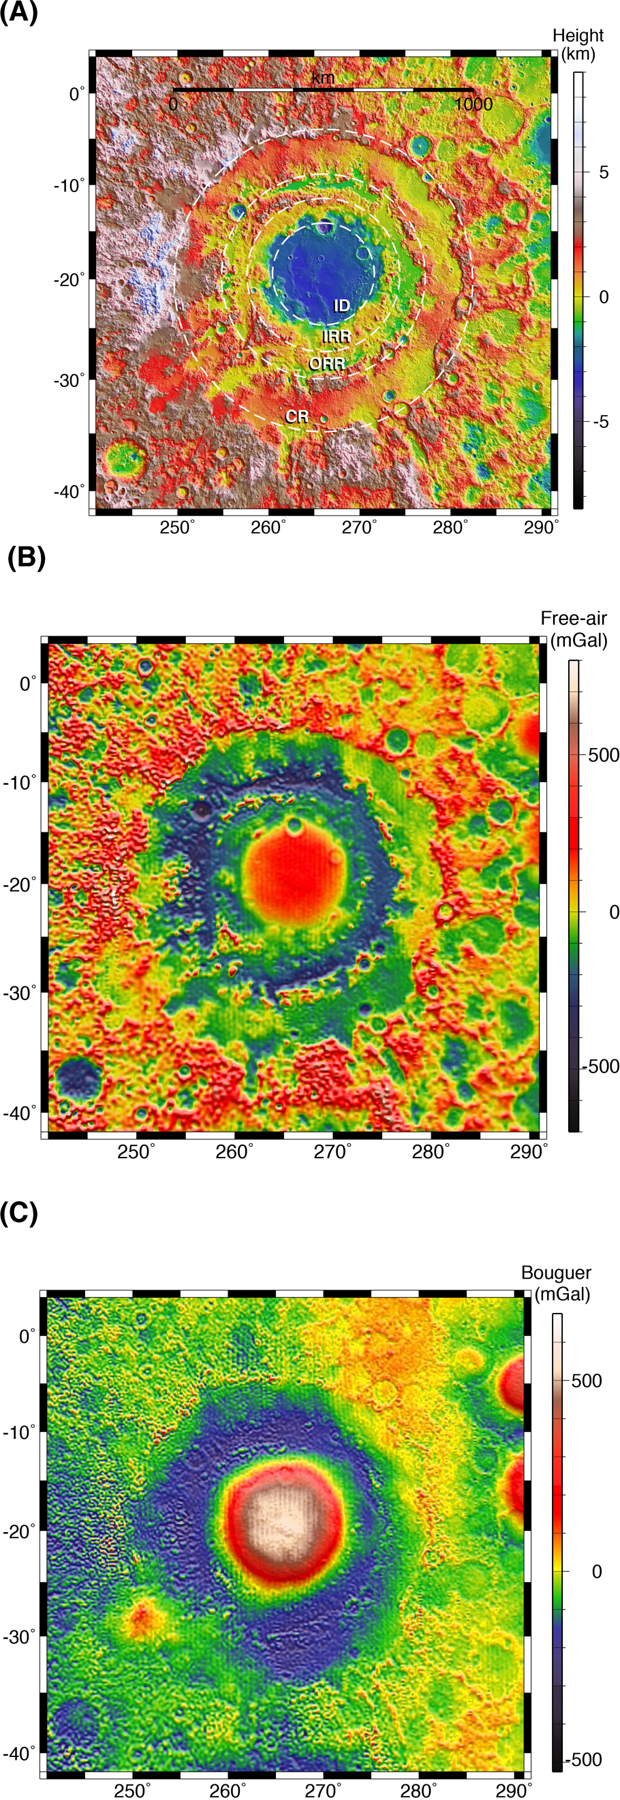
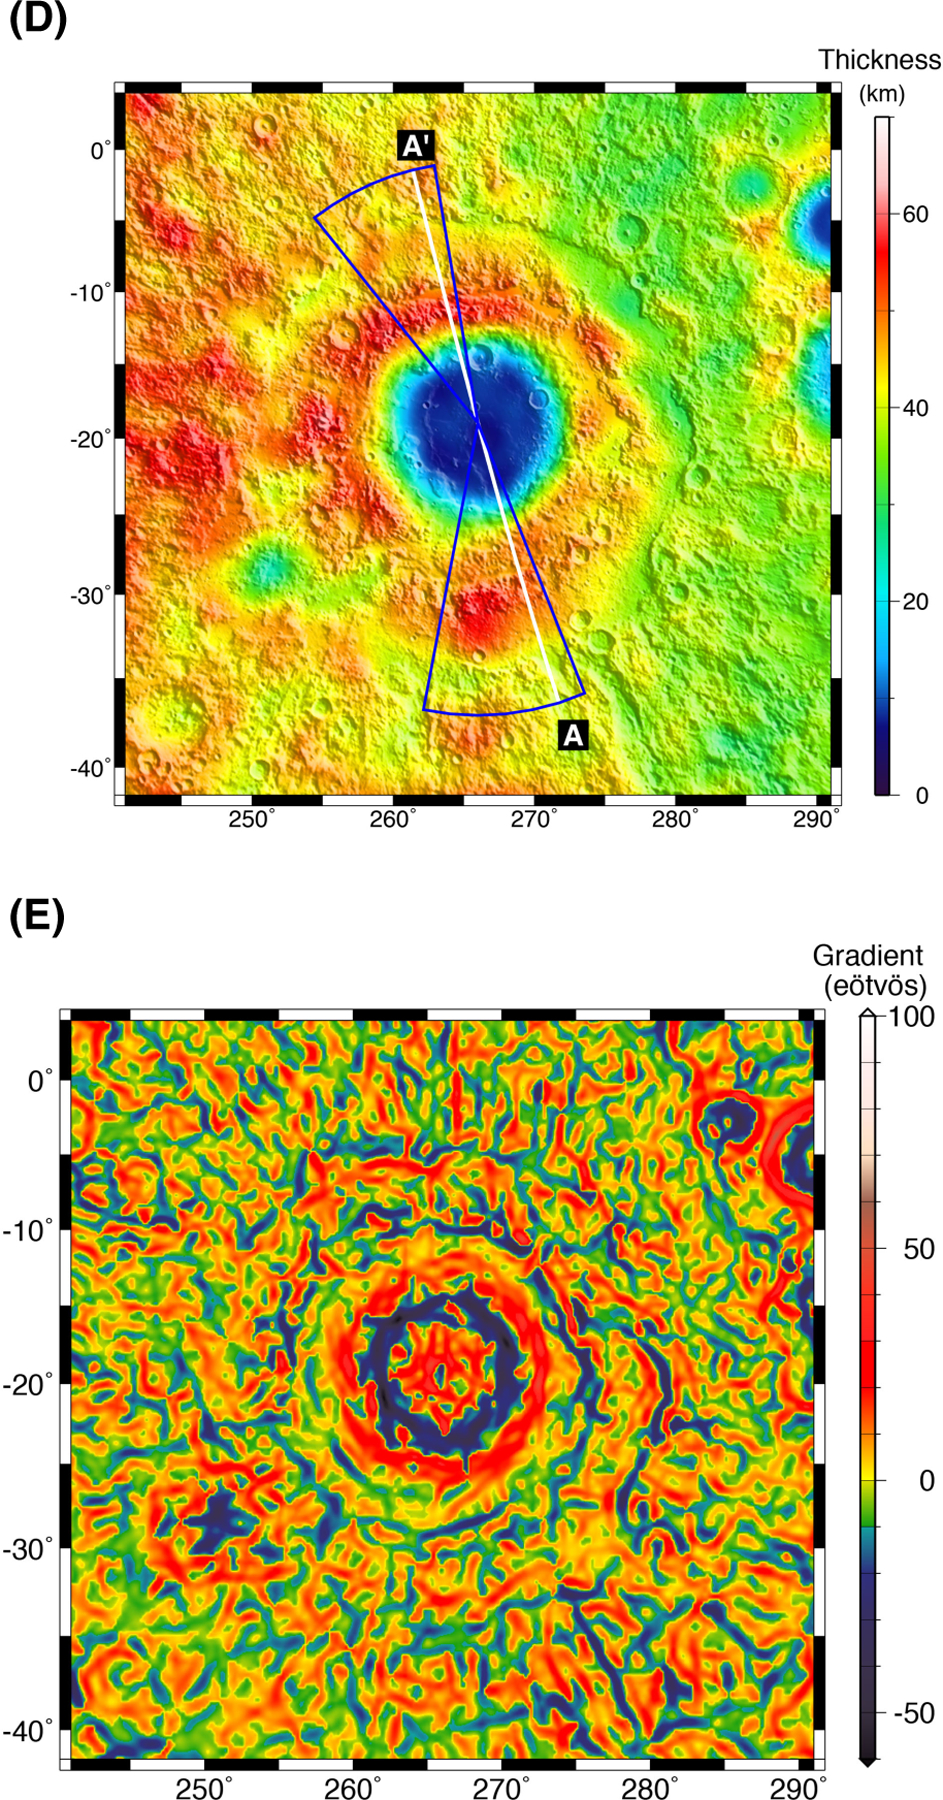
Fig. 1. High-resolution maps.


(A) Topography, (B) free-air anomaly (1mGal= 1 milliGalileo = 0−5 m s−2), (C) Bouguer anomaly, (D) crustal thickness over shaded-relief topography, and (E) Bouguer gravity gradient (1 Eotovos = 10−4 mGal m−1 = 10−9 s−2) of the Orientale basin and surroundings. Dashed lines in (A) from innermost to outermost correspond to the Inner Depression (ID), Inner Rook ring (IRR), Outer Rook ring (ORR), and Cordillera ring (CR). The solid white line in (D) shows the location of the cross-sectional profile A-A’ in Fig. 2a. Blue lines show the locations of the azimuthally averaged cross-sections in Fig. 2b. Topography is updated from Lunar Observer Laser Altimeter (LOLA) (11) map LDEM_64, 0.015625° spatial resolution. To highlight short-wavelength structure, we have subtracted spherical harmonic degrees and orders less than 6 from the Bouguer gravity field. Calculation of crustal thickness and Bouguer gravity gradient are discussed in the Supplementary Online material (9).
