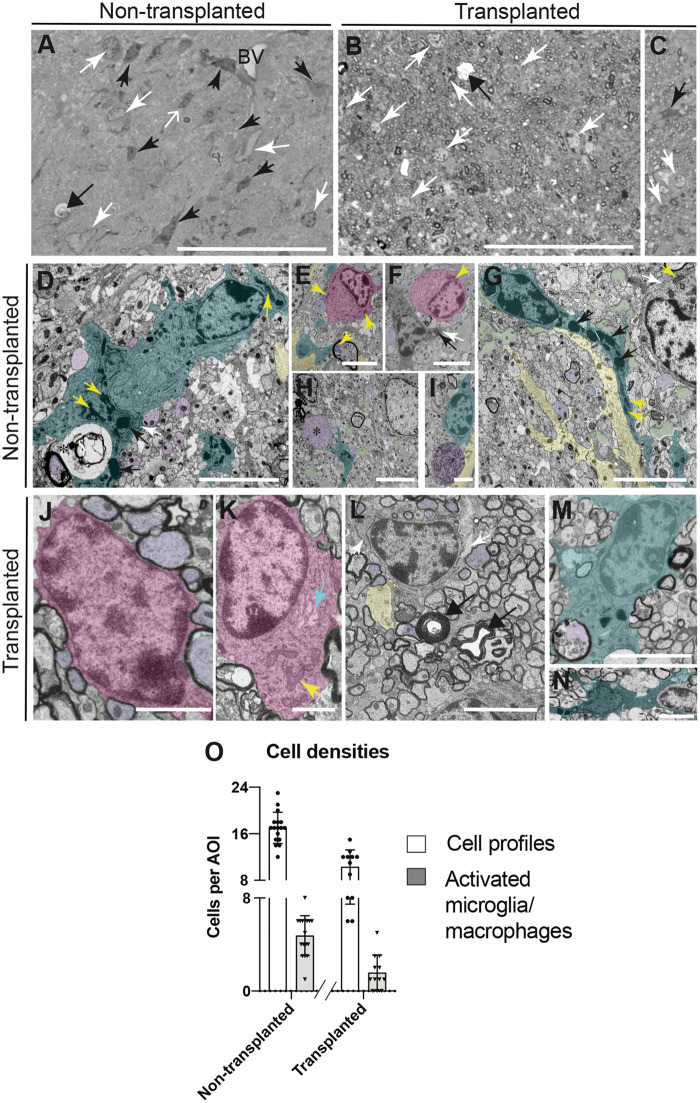
Figure 8.
Neuroinflammation is reduced after transplantation. (A–C) Light microscopy of resin sections of corpus callosum of untreated (A) and transplant recipient (B and C) Plp1-tg mice at P120. Narrow black and white arrows indicate cell profiles, some of which (black arrows) can be identified as microglia/macrophages, due to having a dark nucleus and dark cytoplasm. Cells with a dense nucleus but without a dense cytoplasm (open white arrow in A) were not classified as microglia/macrophages. Occasionally, demyelinating axons (wide arrows in A and B) were observed. Scale bar = 50 μm. (D) Microglia/macrophage (overlaid in turquoise) containing dense lysosomes (black arrows), prominent mitochondria (yellow arrows) and rough endoplasmic reticulum (rER; white arrows) apparently engulfing degenerating myelin (asterisk). Normal-appearing axons are also present (purple); one with a myelin sheath (lower left). Scale bar = 5 μm. (E) An oligodendrocyte (pink) in apposition to non-myelinated axons (purple). In the lower middle, an axon (purple) containing large mitochondria (yellow arrow), is surrounded by degenerate myelin. Microglial/macrophage and astrocyte processes, turquoise and yellow respectively. Scale bar = 5 μm. (F) Oligodendrocyte (pink) in close apposition to non-myelinated axons (purple), adjacent to a microglia/macrophage containing a dense lysosome and prominent rER (black and white arrows, respectively). The yellow arrow points to one of two adjacent mitochondria. Scale bar = 5 μm. (G) A microglia/macrophage extending a long process with dense lysosomes (black arrows). The cell on the top right has prominent mitochondria (yellow arrow) and rER (white arrow). Astrocyte processes (yellow) and pale amorphous material (green), likely reflecting axon loss, were present. Scale bar = 5 μm. (H) Structure resembling a swollen, neurofilament-rich axon (asterisk) close to the process of a microglia/macrophage (turquoise). Most axons appear normal but the pale areas of amorphous material (some shaded green) suggest axons have been lost. The pale nucleus probably belongs to an astrocyte. (I) Microglia/macrophage (turquoise) next to an organelle-rich axon swelling (purple) and astrocyte process (yellow). Scale bar = 2.5 μm. (J) A normal-appearing oligodendrocyte (pink) with a thin rim of cytoplasm is surrounded by myelinated axons. Scale bar = 2.5 μm. (K) Oligodendrocyte with an unusually large soma (as in E and F) containing mitochondria (yellow arrows) and swollen Golgi apparatus (turquoise arrow), suggesting its origin from the Plp1-tg mouse. Scale bar = 2.5 μm. (L and M) Microglia/macrophages apparently engulfing a degenerate myelin profile (L) and a cell resembling an oligodendrocyte (M). Scale bar = 5 μm. (N) Many normal-appearing myelinated axons alongside two redundant myelin profiles (black arrows). The cell in the top right has prominent rER, and a chromatin-rich nucleus. Scale bar = 5 μm. (O) Graph indicating total numbers of cell profiles (white bars) and numbers of ‘activated’ microglia/macrophages (grey bars) per area of interest (AOI) in untreated and transplant recipient P120 Plp1-tg mice. Bars represent mean ± SD. The transplant recipient harboured significantly fewer total cells (P < 0.0001) including significantly fewer microglia/macrophages (P < 0.0001) than the untreated control; taking each area of interest as an independent sample.

