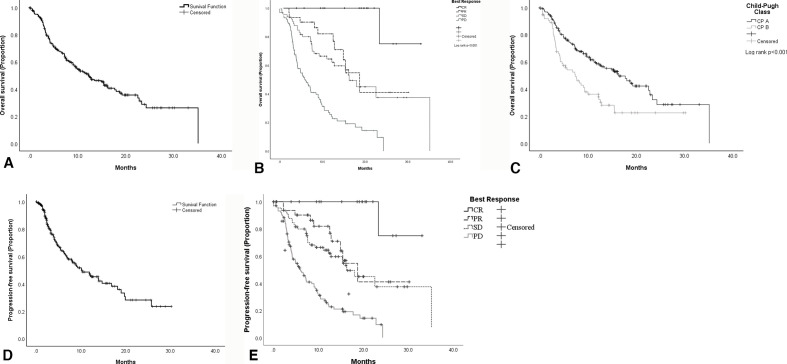
Figure 3.
Kaplan-Meier curves describing the overall survival of the whole patient cohort (A) stratified by best radiological response (B) and Child-Pugh (CP) class (C). (D) Patients’ progression-free survival stratified by best radiological response (E). CR, complete response; PD, primary disease; PR, partial response; SD, stable disease.

