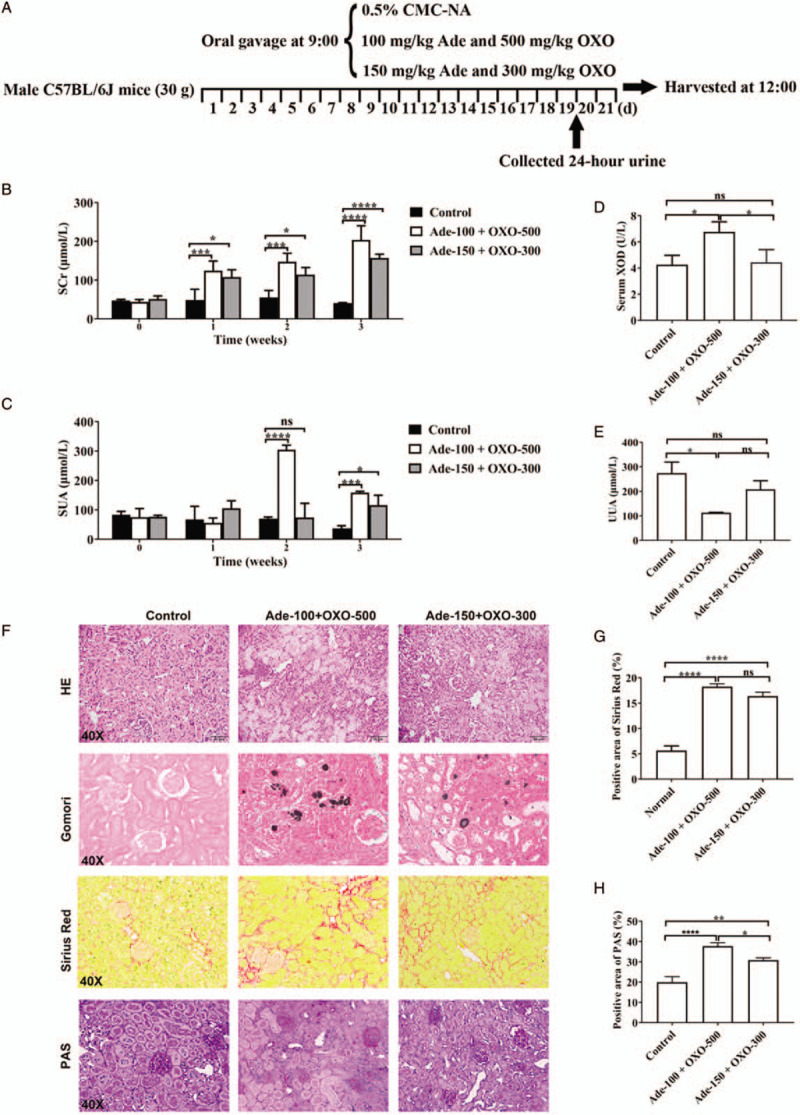
Figure 1.

Effects of adenine (Ade) and OXO on renal function and uric acid distribution in mice. (A) Overview of the hyperuricemia model procedure. (B) Serum créatinine (SCr) level. (C) Serum uric acid (SUA) level. (D) Activity of serum XOD. (E) Urinary uric acid (UUA). (F) Representative histology of H&E, Gomori methenamine silver, Sirius red, and PAS staining (original magnification ×40). (G, H) Quantification of positive staining areas was measured by Image J software. Data are presented as mean ± standard deviation. n = 6 per group. ∗P < 0.05, ∗∗P < 0.01, ∗∗∗P < 0.001, ∗∗∗∗P < 0.0001. Similar results from three independent experiments are shown. CMC-Na: Carboxymethyl cellulose sodium; XOD: Xanthine oxidase; H&E: Hemotoxylin and eosin; OXO: Oxonate; PAS: Periodic acid-Schiff; ns: Not significant.
