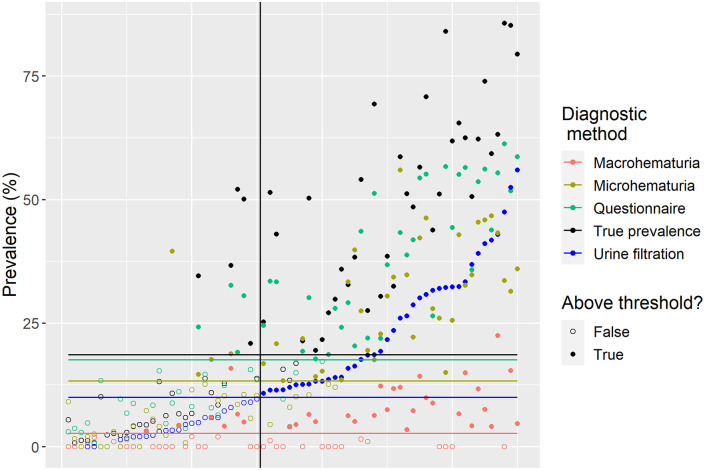
Fig 4. District prevalence for all 70 districts surveyed in Zimbabwe and the four diagnostic methods including the estimated ‘true’ prevalence ordered by urine filtration prevalence on the x-axis.
The vertical line indicates the 10% urine filtration prevalence border. Filled dots to the left of this line are false positive, while empty dots to the right are false negatives. The horizontal lines show the determined threshold for each diagnostic method.

