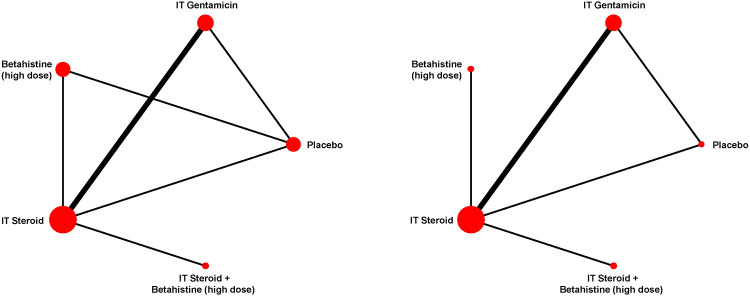
Fig 2. Network diagram of hearing change (left) and complete vertigo control (right).
Each line links interventions and comparators directly compared. The size of treatment nodes was weighted by the number of patients, while the width of the edges each representing a pairwise comparison was weighted by the number of studies. Note: IT steroid plus high-dose betahistine has not been compared in head-to-head trials against other interventions except for IT steroid alone.

