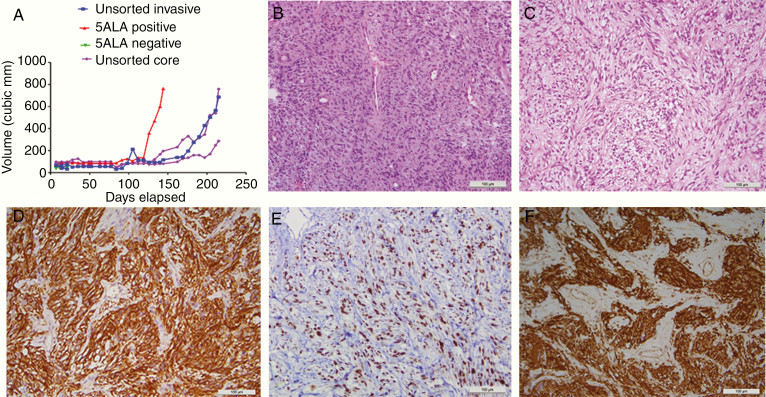
Figure 6.
In vivo growth and immunohistochemistry. (A) Relative growth rates over time since the implantation of mixed unsorted (invasive margin or tumor core) cell xenografts (blue and purple lines), 5-ALA/FACS-negative cells (with no measurable tumor after day 20, green lines), and 5-ALA/FACS-positive invasive cells (red line), showing no growth for 5-ALA/FACS-negative cells and quicker growth for 5-ALA/FACS positive compared to unsorted mixed cells. (B) H&E of patient GBM (×40) from which a 5-ALA/FACS-positive xenograft was derived. (C) H&E of a flank xenograft in mouse, demonstrating GBM-like morphology. (D) Positive GFAP (astrocytic marker) IHC for mouse 5-ALA/FACS-positive GBM xenograft. (E) Positive IHC for Ki67 (proliferative marker) for mouse flank 5-ALA/FACS-positive GBM xenograft. (F) Positive IHC for vimentin (mesenchymal marker) in mouse 5-ALA/FACS-positive GBM xenograft (all scale bars 100 μm).

