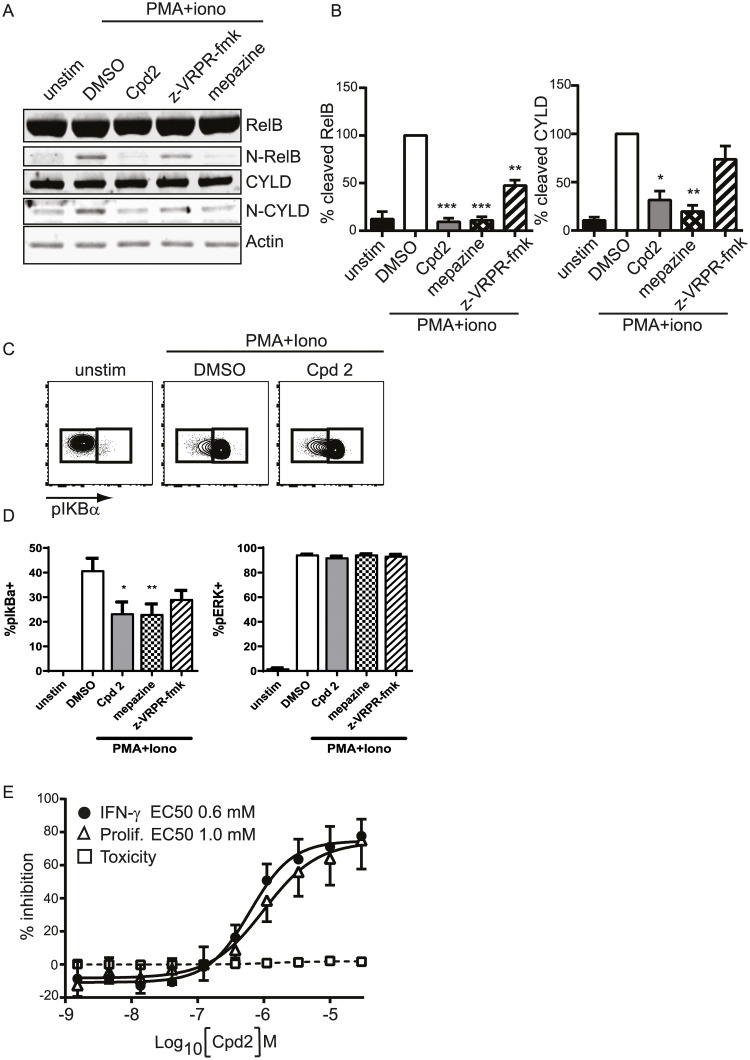
Fig 2. Characterization of allosteric MALT1 inhibitor Compound 2.
Purified human primary CD4+ T cells were stimulated with PMA and ionomycin in the presence of MALT1 inhibitors. Compound 2 and mepazine were used at 10 μM and z-VRPR-fmk at 300 μM (A-B) or 100 μM (C-D). (A) Western Blot analysis of RELB and CYLD, their cleaved product (N-RELB and N-CYLD). (B) Quantification of cleaved RELB and CYLD. All quantitative data were normalised to actin signal and calculated as a percentage relative to DMSO signal set at 100%. Data are presented as mean+/SEM with n = 4. *:p<0.05; **:p<0.005; ***:p<0.001. (donor-matched one-way ANOVA with Dunnett’s multiple comparison test) (C) Representative FACS plots of phosphorylated IκBα in CD4+ T cells following stimulation with PMA and ionomycin for 10minutes. (D) Quantification of FACS analysis of pIκBα and pERK positive cells. Data are presented as mean+/SEM with n = 3. *p<0.05; **:p<0.005. (donor-matched one-way ANOVA with Dunnett’s multiple comparison test) (E) Inhibition of IFN-γ secretion (black circles) by Compound 2 in human CD4+ cells stimulated with anti-CD3 antibody plus anti-CD28 antibody for 3 days. Proliferation (open triangles) and cytotoxicity (open squares) were measured using CFSE and 7-AAD by flow cytometry 3 days post-stimulation. Data are shown as % inhibition from 6 donors (mean ± 95% CI). EC50 values are annotated.

