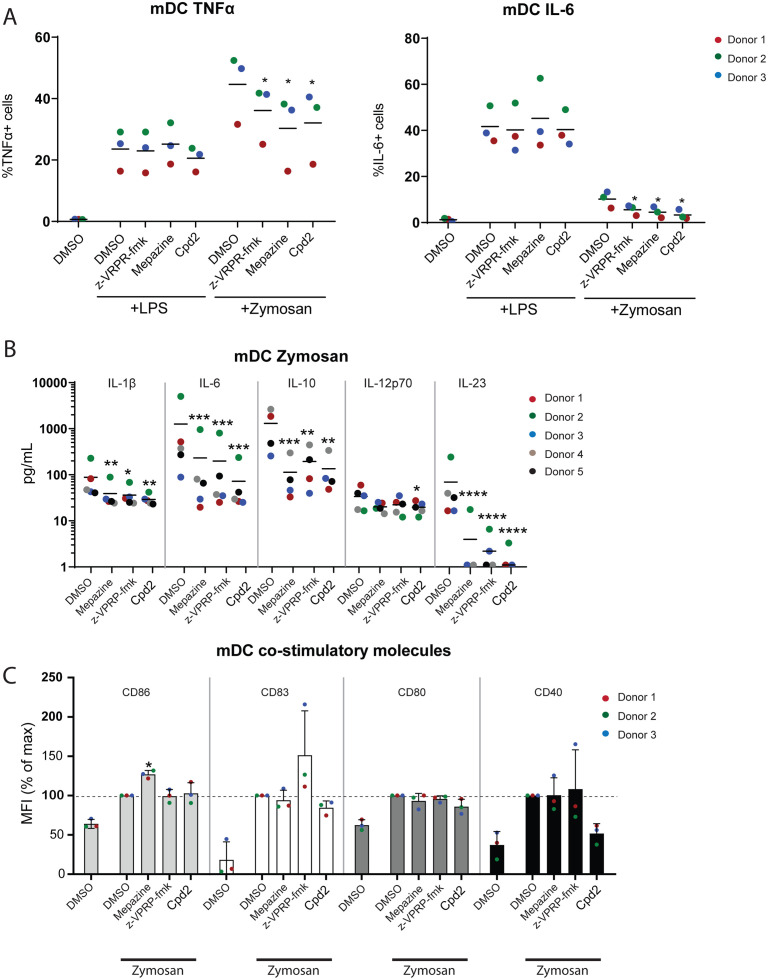
Fig 3. MALT1 inhibition in mDCs decreases cytokine production in zymosan-treated cells.
(A) Unstimulated PBMCs, 5-hour LPS- or zymosan-stimulated PBMCs (pre-treated for 30 minutes with DMSO, 10 μM mepazine, 100 μM z-VRPR-fmk or 10 μM Compound 2) were analyzed by flow cytometry for intracellular expression of TNF-α or IL-6 in mDCs. Data is representative for 1 out of 3 independent experiments. Coloured dots indicate data from 3 individual donors. * p<0.05. (donor-matched one-way ANOVA with Dunnett’s multiple comparison test) (B) Expression of cytokines in the supernatant of ex vivo purified zymosan-treated mDCs after MALT1 inhibition as measured by MSD. Coloured dots indicate data from 5 individual donors. *:p<0.05; **:p<0.005; ***:p<0.001; ****:p<0.0001. (donor-matched one-way ANOVA with Dunnett’s multiple comparison test) (C) Flow cytometric analysis of the effect of MALT1 inhibition on the expression CD80, CD83, CD86 and CD40 on mDCs upon 5-hour zymosan stimulation of PBMCs. Bars represent mean ± SD and dots show individual donors (n = 3). In all experiments, values are normalized to zymosan-stimulated cells without MALT1 inhibition (set to 100%).

