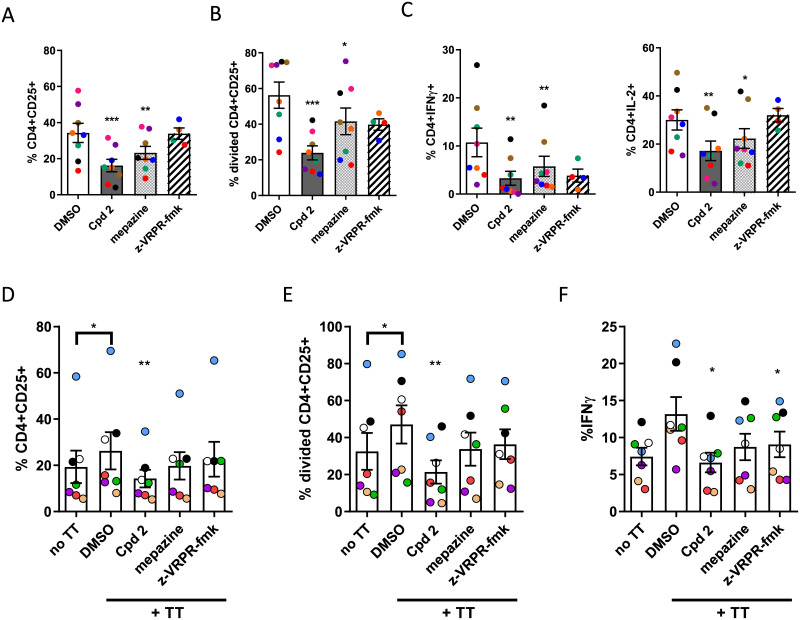
Fig 4. Effect of allosteric MALT1 inhibitors on activation, proliferation and cytokine production of human CD4+ T cells.
The top panel (A-C) shows the effect of MALT1 inhibitors on CD4+CD45RA+ human T cells stimulated for 3 days with anti-CD3 + anti-CD28 antibody stimulated. Data is presented as the percentage of (A) cells expressing the activation marker CD25, (B) the percentage of cells that have divided, measured by Cell Trace Violet fluorescence intensity dilution and (C) the percentage of CD4+ cells producing IL-2 and IFN-ɣ analysed by multi-color flow cytometric analysis. Data are presented as mean ± SEM with n = 8. Coloured dots indicate data from individual donors across different stimulations.*:p<0.05; **:p<0.005; ***:p<0.001 (donor-matched one-way ANOVA with Dunnet’s multiple comparison test compared to DMSO control). The lower Panel shows the effect of the allosteric MALT1 inhibitor Compound 2 on human CD4+ CD45RO+ T cells co-cultured for 6 days with tetanus toxoid pulsed monocyte-derived dendritic cells in presence or absence of MALT1 inhibitors. Data is presented as the percentage of (D) cells expressing CD25, (E)the percentage of cells that have divided and (F) the percentage of cells producing IFN-ɣ as measured by flow cytometry. Experiments were considered positive when the mean proliferation of tetanus toxoid stimulated T-cells was greater than the mean+2SD of T-cells stimulated with unpulsed DCs. Data are presented as mean ± SEM with n = 7. Coloured dots indicate data from individual donors across different stimulations.*:p<0.05; **:p<0.001 (donor-matched one-way ANOVA with Dunnett’s multiple comparison test compared to DMSO control). In all experiments, 10 μM Compound 2, 5 μM mepazine or 100 μM z-VRPR-fmk were used.

