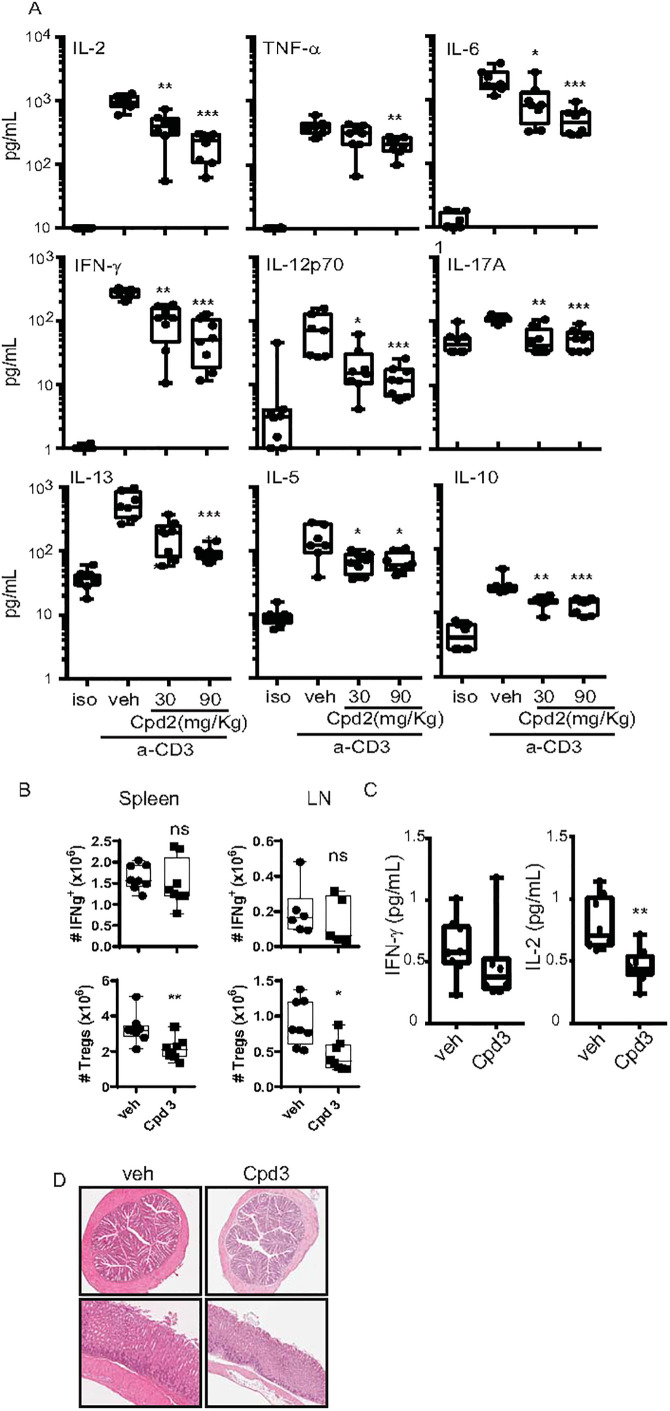
Fig 8. Effect of the allosteric MALT1 inhibitors on anti-CD3 antibody induced cytokines and on IFN-γ producing-CD4+ T cells and FoxP3+Tregs in vivo.
Blood of C57BL/6 females was collected 4h after anti-CD3 or IgG isotype control antibody injection (i.p) following 30 min pre-treatment with Compound 2 (i.p) at 30 and 90 mg/kg. (A) plasma cytokine levels in C57BL/6 mice 4 h after intraperitoneal anti-CD3 antibody injection following 30 min pre-treatment with 2 at 30 and 90 mg/kg (n = 7–8). (B) C57BL/6 mice treated orally with Compound 3 at 10 mg/kg twice daily for 4 weeks (n = 8 per group). Quantification of numbers of IFN-ɣ producing CD4+ T cells and FoxP3+ CD4+CD25high regulatory T-cells in spleen and lymph nodes (LN) as assessed by flow cytometry. (C) Quantification of plasma IFN-ɣ and IL-2 levels following 4-week treatment with Cpd 3. Cytokines levels were analysed by multiplex MSD analysis. Dots represent individual mice and data is presented as a Box and whiskers plot. (D) Representative H&E-stained colon (top) and stomach fundus (bottom) from 4-week Cpd 3 treated mice. Data were evaluated by unpaired two-sided t test with Welch’s correction against the vehicle group *:p<0.05; **:p<0.01;***:p<0.001.

