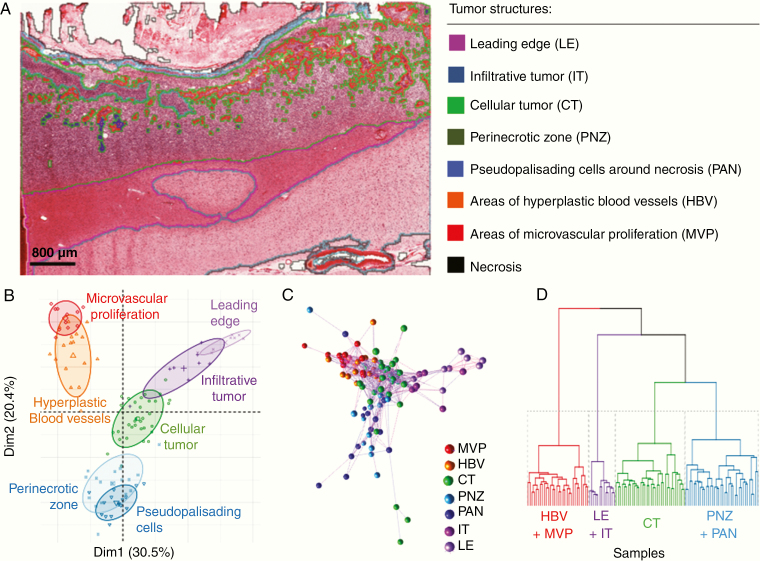
Figure 1.
Variation in glioblastoma sample gene expression is primarily explained by histologic structure. (A) Representative image demonstrating the histologic structures that were microdissected, subject to RNAseq and archived in the IvyGAP database by the Allen Brain Institute, scale bar = 800 µm. (B–D) Analysis of the 1000 most variable genes in the IvyGAP data set. (B) Principle component analysis of dimensions 1 (Dim1) and 2 (Dim2) demonstrates that most variation in the data is explained by the histologic structure from which the RNA was extracted. Individual samples (symbol) are colored by the structure they is from; ellipse level = 0.66. (C) Correlation network analysis shows samples (nodes) from a histologic structure cluster. Colors depict the structure samples came from; edge length represents the degree of correlation between samples. (D) Dendrogram of hierarchically clustered (k = 4) samples demonstrating structures with the most similarity.

