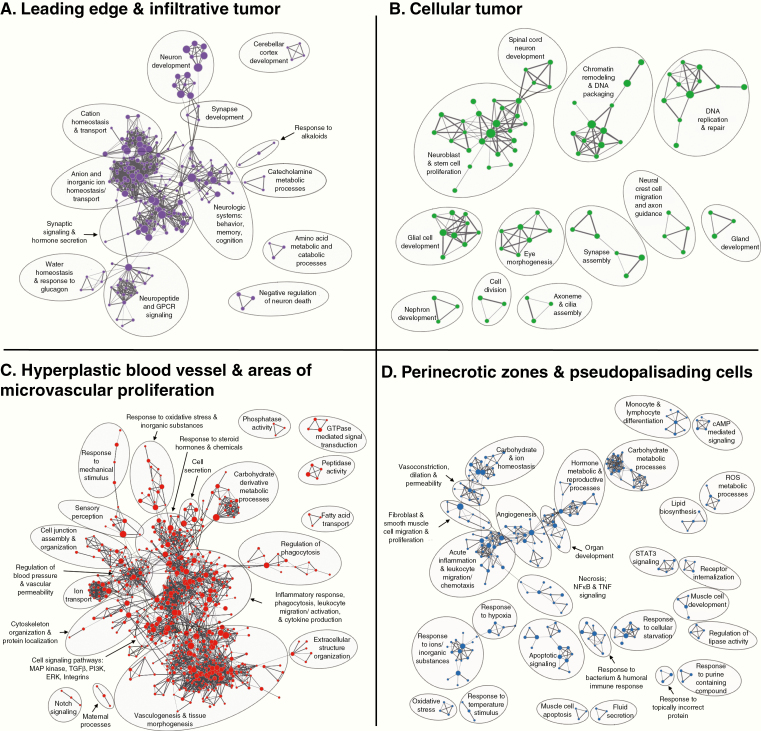
Figure 2.
Biological processes enriched in glioblastoma structures. Enrichment map visualizations of GSEA demonstrating gene ontology (GO) biological processes enriched in the (A) LE and IT, (B) CT, (C) HBV and MVP, and (D) PNZ and PAN, relative to the rest of the tumor. Nodes represent GO terms. Functionally related clusters were manually circled and labeled. Node color represents the structure enriched (purple: LE/IT; green: CT; dark orange: HBV/MVP; blue: PNZ/PAN). Node size within each structure quadrant is proportional to the number of genes within each GO term. Edge thickness signifies degree of overlap between GO terms (number of genes shared between 2 gene sets).

