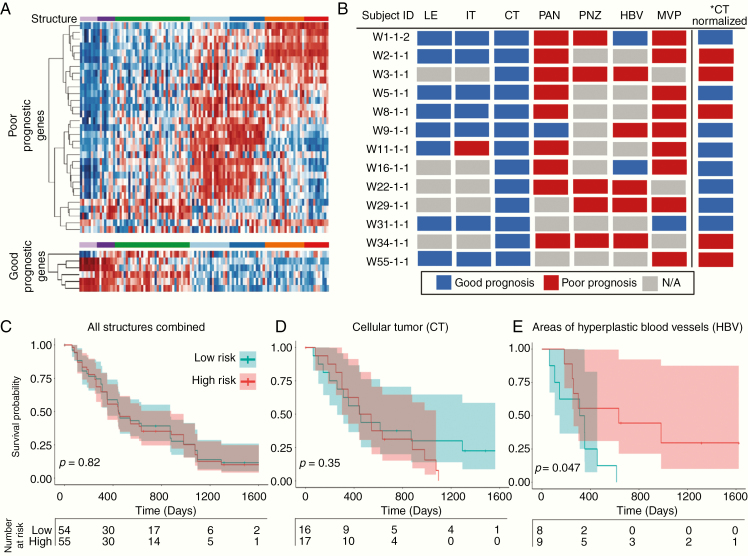
Figure 4.
Established prognostic gene signature expression is driven by glioblastoma structure. (A) A survival prediction gene set demonstrates differential expression in tumor structures, with opposite expression in the IT/LE and the PAN/PNZ/HBV/MVP. Transcripts were organized independently by unsupervised hierarchical clustering. (B) Prognostic prediction for samples from subjects with data from ≥4 structures, with prognosis determined by sample metagene score. A single subject can be predicted to have high- or low-risk depending on which structure is analyzed. *CT normalized represents CT samples that underwent z-score normalization utilizing only the CT samples rather than all structure samples. (C) Kaplan–Meier survival analysis of all IvyGAP samples. (D) Kaplan–Meier analysis using a metagene score calculated applying CT samples, demonstrating a trend in survival stratification. (E) Kaplan–Meier analysis using a metagene score calculated applying only HBV samples, significantly and incorrectly stratified long versus short survivors. For survival analyses, metagene scores were used to risk stratify (poor prognosis: metagene score >0; good prognosis: metagene score <0).

