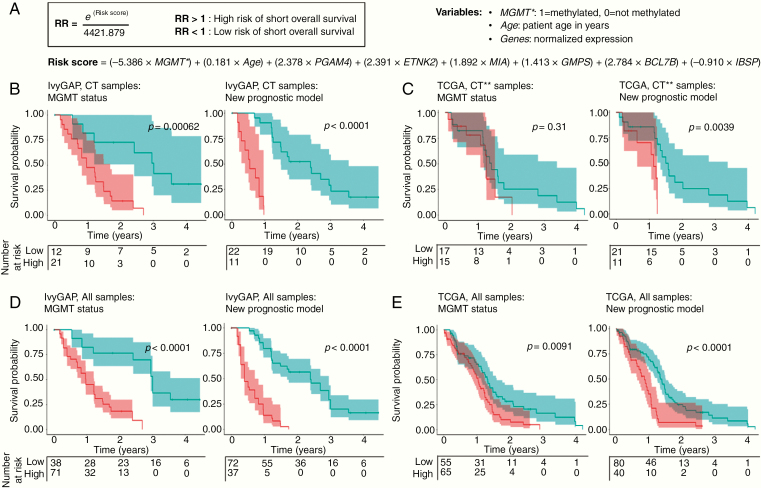
Figure 5.
Novel prognostic gene signature created utilizing CT expression data. (A) Risk score and hazard ratio (HR) prediction equation created using a novel prognostic model for glioblastoma. The risk score is the sum of the products of defined weighting factors with the corresponding predictors, MGMT promoter methylation status (0: not methylated; 1: methylated), patient age (in years), and normalized expression values of 6 genes. Kaplan–Meier survival analysis of (B) IvyGAP CT samples, (C) CT-predicted TCGA samples, (D) all IvyGAP samples, and (E) all TCGA samples dichotomized into high- and low-risk groups by MGMT methylation (left) and predicted HR (right). For MGMT methylation, survival was evaluated by separating samples into methylated (low-risk) or unmethylated (high-risk) groups. Tertiles of HR values were used to risk stratify (high-risk: HR > quantile (⅔); low-risk: HR < quantile (⅔)). Shading on survival lines correspond to 95% confidence intervals. *MGMT promoter methylation status. **Samples predicted to be predominantly CT.

