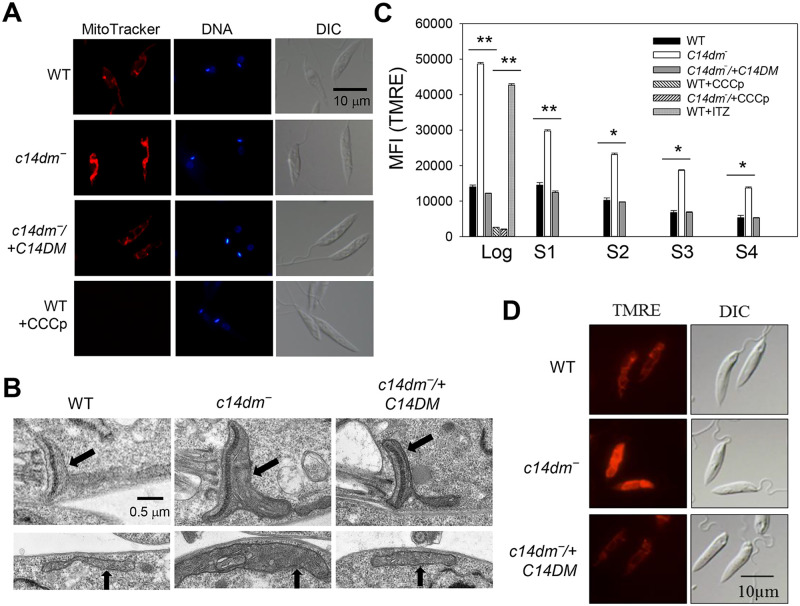
Fig 1. C14dm‾ promastigotes show high mitochondrial membrane potential (ΔΨm).
(A) Log phase promastigotes were labeled with 100 nM of Mitotracker CMXRos followed by DAPI staining. WT parasites pretreated with CCCp were included as controls. DIC: differential interference contrast. (B) Representative transmission electron micrographs showing mitochondria in log phase promastigotes. Black arrows indicate areas containing kinetoplast (top panel) and tubular mitochondria (bottom panel). (C) To measure ΔΨm, log phase and stationary phase (day 1-day 4) promastigotes were labelled with 100 nM of TMRE for 15 min in PBS and mean fluorescence intensity (MFI) were determined by flow cytometry. Controls include WT and c14dm‾ parasites pretreated with CCCp and WT cells pretreated with 0.2 μM of ITZ. Bar values represent averages from three experiments and error bars represent standard deviations. (D) Live parasites imaging after TMRE labeling.

