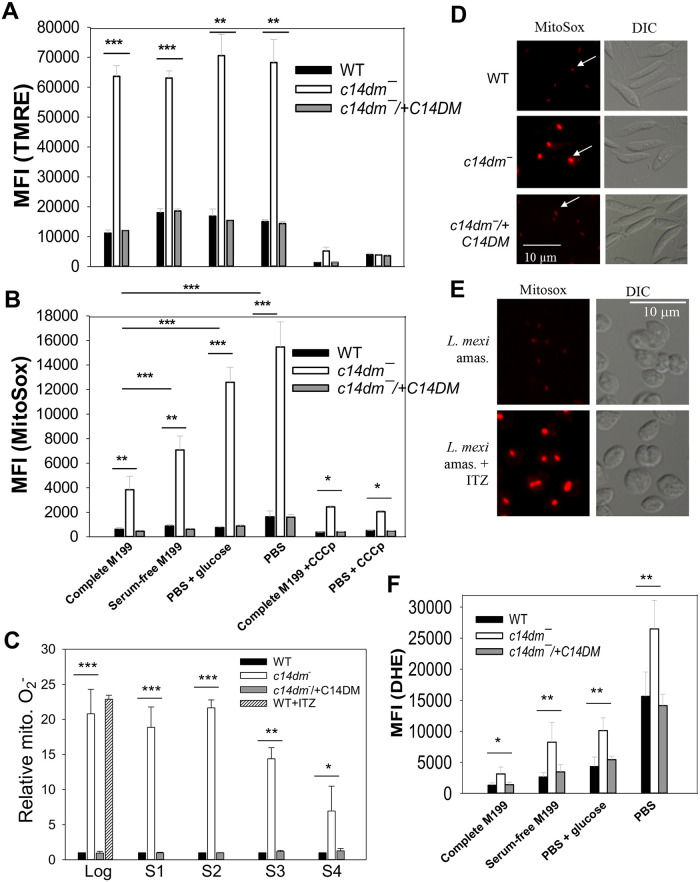
Fig 2. Inactivation of C14DM leads to ROS accumulation in the mitochondria.
(A, B and F) Promastigotes were incubated in complete M199, serum-free M199, PBS contain 5.5 mM of glucose, or PBS only and labeled with 100 nM of TMRE (A, for 15 min), 5 μM of MitoSox Red (B, for 25 min) or 5 μM of DHE (F, for 30 min). MFIs were determined by flow cytometry. Effects of CCCp (75 μM, 15 min) were also monitored in A and B. (C) Log or stationary phase (day 1-day 4) promastigotes were labeled with 5 μM of MitoSox Red for 25 min in PBS and MFIs were determined by flow cytometry and normalized to values from log phase WT. WT cells grown in the presence of ITZ (for 48 hours) were also analyzed. (D and E) Live cell imaging of L. major promastigotes (D) or L. mexicana axenic amastigotes (grown in the absence or presence of 0.1 μM of ITZ for 48 hours, E) after labelling with MitoSox Red in PBS. White arrows indicate kDNA binding of MitoSox. (E) Live after labeling with MitoSox Red. In A-C and F, averaged values from five experiments are shown and error bars represent standard deviations.

