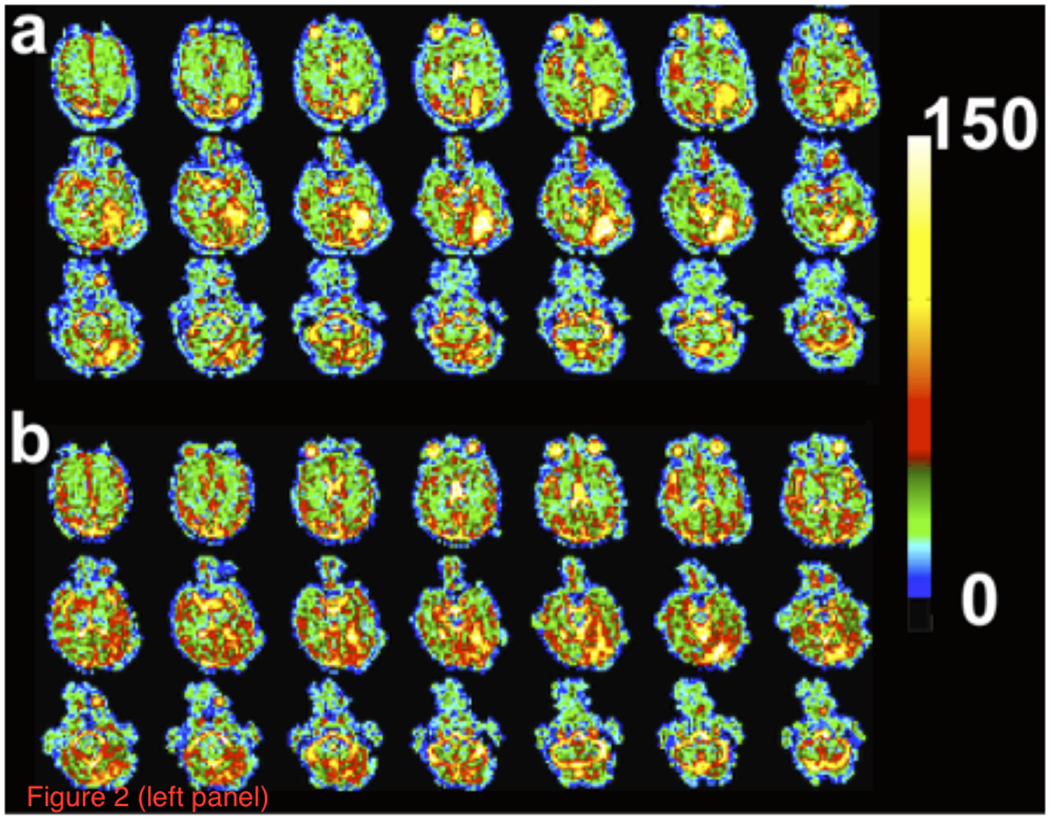
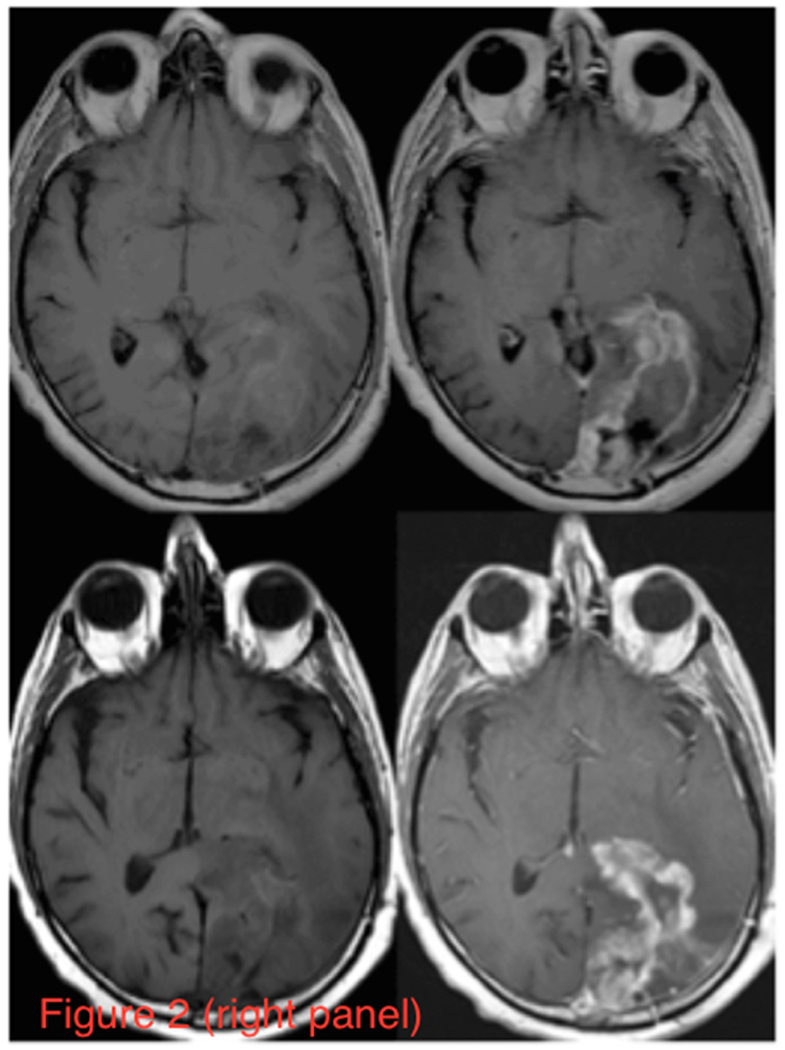
Figure 2.


Sodium and proton MR imaging of a representative patient with a resected glioblastoma in the inferior left temporo-occipital region. (Left Panel) Axial partitions of the 3D TSC bioscale of a patient showing increased sodium concentration in the surgical resection site (a) before and (b) after standard chemoradiation treatment. Color scale at right is in units of mM. Note that two partitions on the far right on the top row of Figures 1a and 1b are the partitions displayed in Figure 3.
(Right Panel) T1 weighted images pre- (left column) and post- (right column) intravenous administration of gadolinium contrast for the same patient (upper row) prior to and (lower row) following chemoradiation treatment. The left cerebral hemisphere shows the surgical cavity filled with CSF and surrounding tissue with elevated TSC from tumor infiltration and edema. Radiation treatment shrinks the cavity, but the residual tumor persists in the margins.
