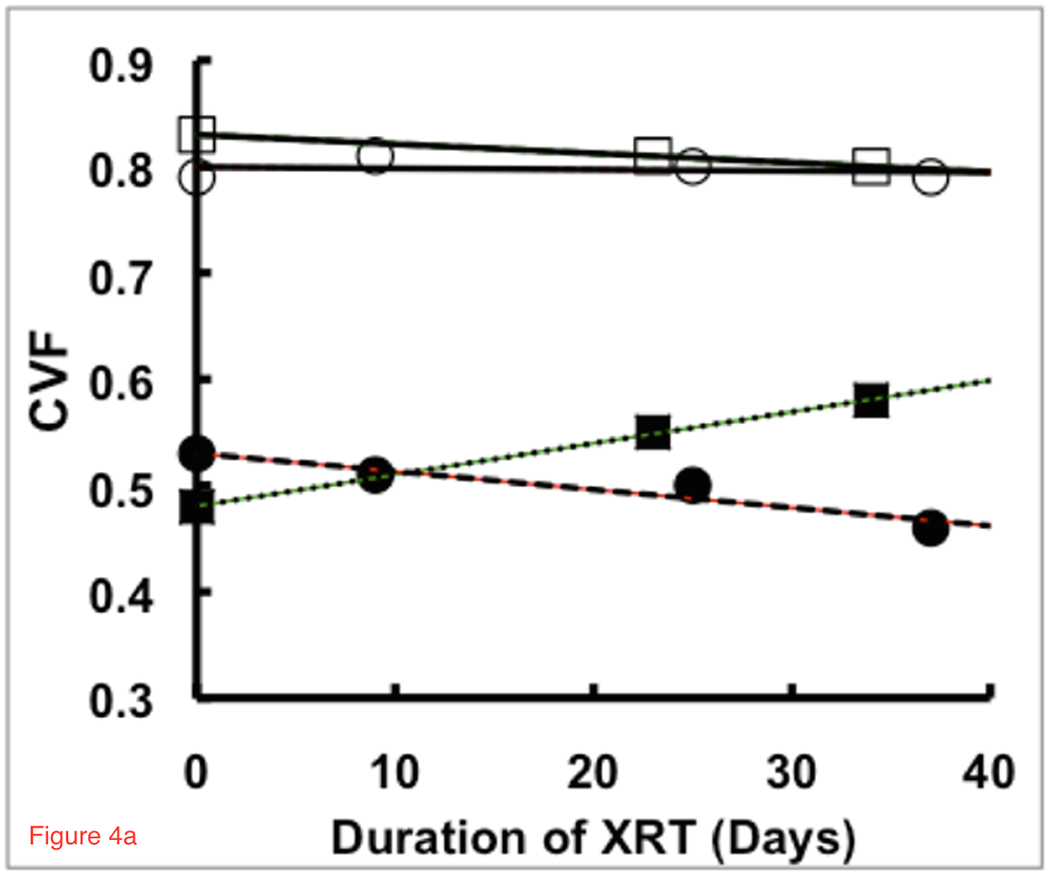
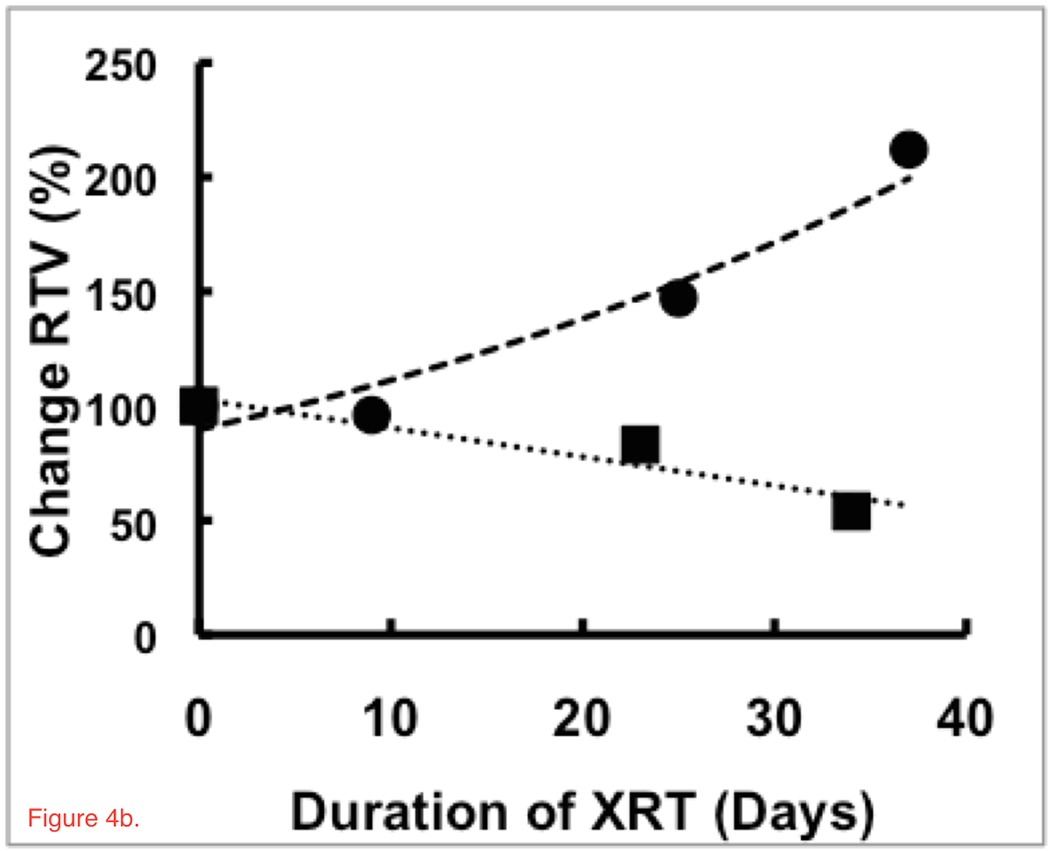
Figure 4.


Trends in (a) CVF and (b) RTV for treatment regions of two patients with responses that show statistically significant (R>±0.95, p<0.04) increases (solid squares, dotted line) and decreases (solid circles, dashed line) in CVF during chemoradiation treatment whereas the control regions remain stable (open squares and circles, solid lines). These patients showed significant inverse responses between RTV and CVF, matching the model in Figure 1. The patient with the decrease in CVF had an increasing RTV and a survival time of 344 days. The patient with an increasing CVF and decreasing RTV returning towards normal values had a longer survival time of 547 days. These patients were of similar age with similar sized glioblastomas initially but showed very different responses and survival under the same treatment protocol.
