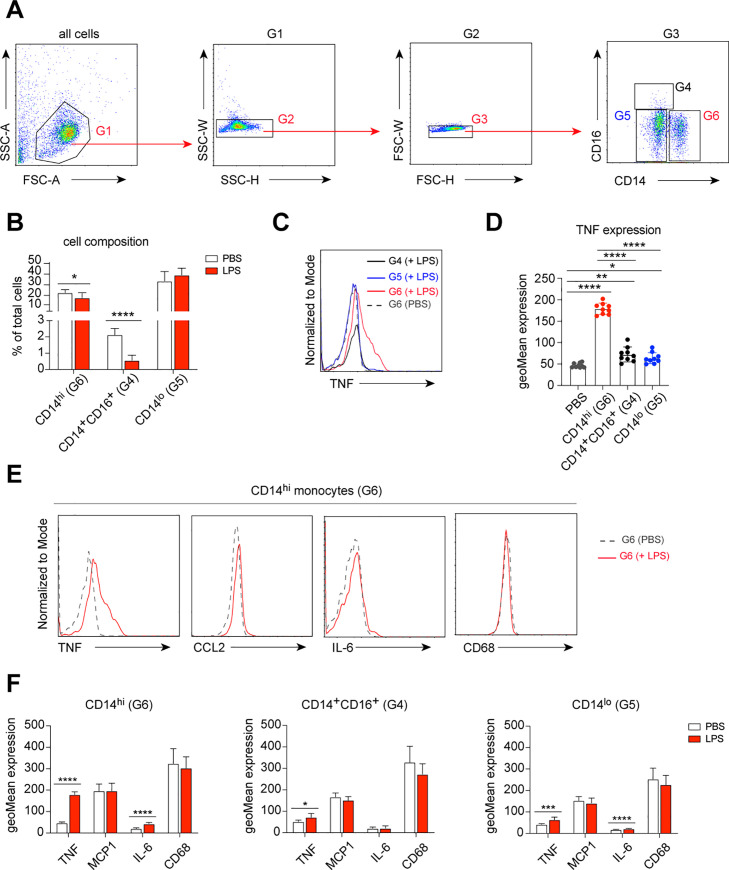
Fig 2. LPS-induced cytokine production of cultured monocytes.
(A) Dot plots demonstrate flow cytometric gating strategy used to obtain monocytes (G4, G5 and G6) for all samples. (B) Bar graphs show changes in monocyte composition after LPS stimulation, compared with naïve monocytes. Multiple t-test, corrected for multiple comparisons using Holm-Sidak method, *P < 0.05, **P < 0.01, ***P < 0.001, ****P < 0.0001. (C) Histograms demonstrate fluorescent intensity representing LPS-induced TNF expression in different monocyte subsets, compared to naïve monocytes (unstimulated, PBS-treated). (D) Bar graphs show quantitative analysis of fluorescent intensity representing LPS-induced TNF expression in different monocyte subsets, compared to naïve monocytes (unstimulated, PBS-treated). Each dot represents an independent measurement. One-way ANOVA, corrected for multiple comparisons using Tukey Test, *P < 0.05, **P < 0.01, ***P < 0.001, ****P < 0.0001. (E) Histograms demonstrate fluorescent intensity representing LPS-induced cytokine expression of CD14hi monocytes (red line), compared to naïve CD14hi monocytes (unstimulated, PBS-treated; dashed line). (F) Bar graphs show quantitative analysis of fluorescent intensity representing LPS-induced cytokine expression in different monocyte subsets, compared to naïve monocytes (unstimulated, PBS-treated). One-way ANOVA, corrected for multiple comparisons using Tukey Test, *P < 0.05, **P < 0.01, ***P < 0.001, ****P < 0.0001.

