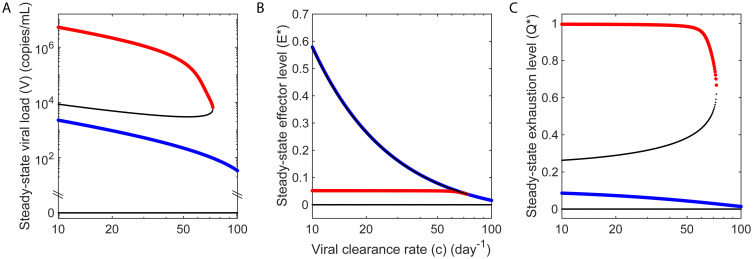
Fig 5. Bifurcation diagrams indicating the two distinct outcomes of progressive disease and viremic control.
Model calculations of the steady state (a) viral load, (b) normalized effector level (E* = EdE/ρ), and (c) normalized level of exhaustion (Q* = Qdq/κ), obtained by varying the viral clearance rate. The stable states of progressive disease and viremic control are shown in red and blue, respectively. Thin black lines represent unstable steady states. In (b), the intermediate unstable state lies close to the state of viremic control. The steady states are separated by other state variables, including the level of exhaustion, evident in (c). Parameter values used are in Tables 1 and 2. Bifurcation diagrams for other parameters are shown in S15 Fig.

