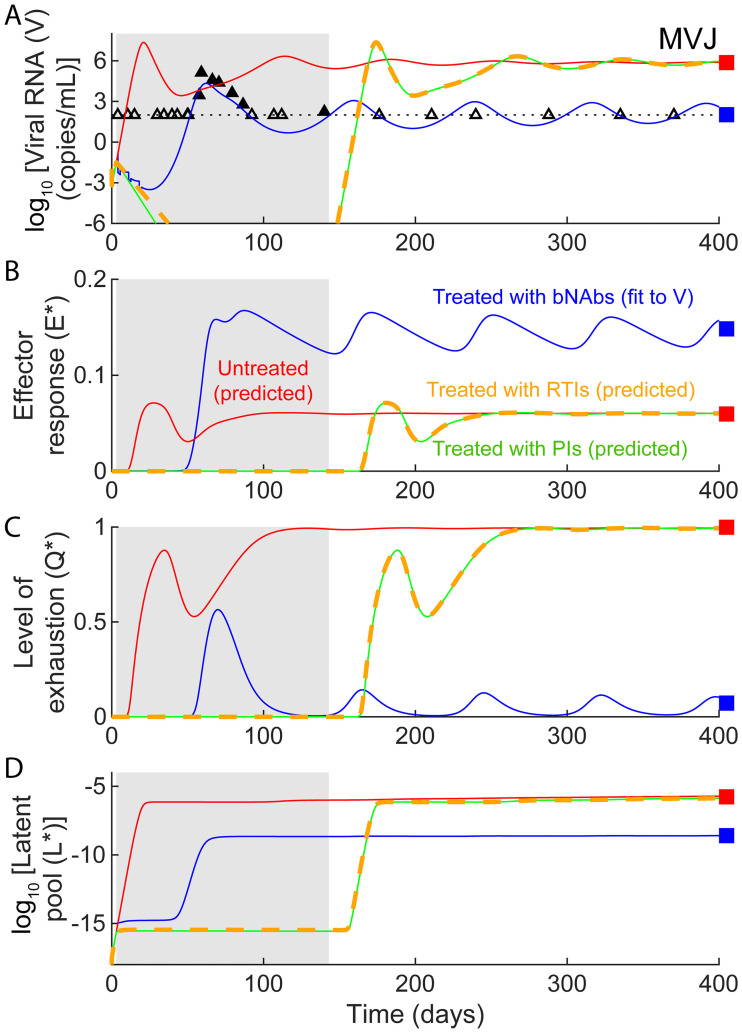
Fig 8. bNAbs succeed whereas ART fails to establish long-term viremic control.
Simulated dynamics of (a) viral load, (b) effector response, (c) effector exhaustion, and (d) the latent reservoir, are shown with ART (reverse transcriptase inhibitors—green solid lines, protease inhibitors—orange dashed lines; Methods) in comparison with the corresponding dynamics without treatment (red lines) and with bNAb treatment (blue lines) using parameters that capture in vivo data for the macaque MVJ (symbols). (Parameter values used are in Table 1 and S1 Table). The duration of ART is shown as a gray region. The black dotted lines in (a) indicates the viral load detection limit (100 RNA copies/mL).

