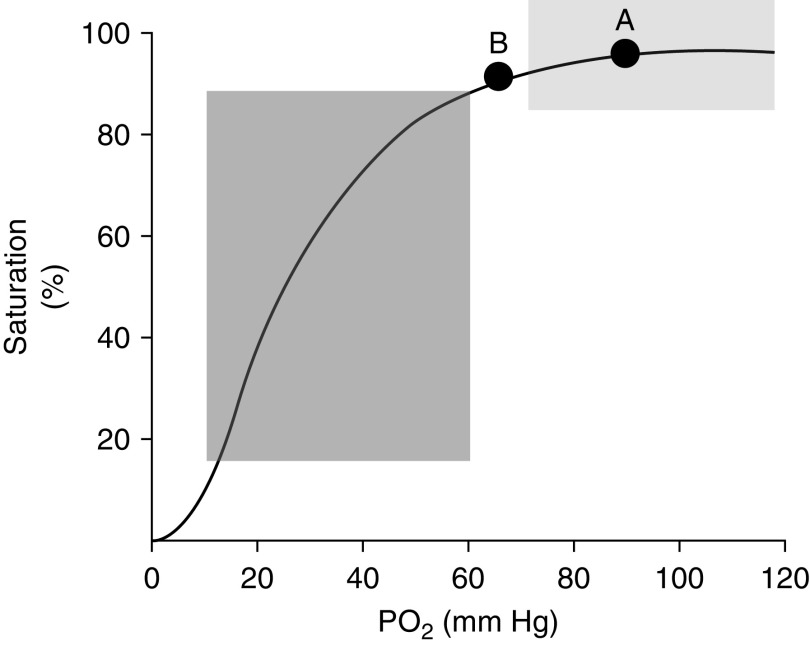
Figure 2.
The hemoglobin-oxygen dissociation curve. The light-gray shaded area highlights the flat portion of the curve where the oxygen saturation remains relatively stable as the partial pressure of oxygen (Po2) falls. The dark-gray shaded area highlights the steeper portion of the curve where small changes in the Po2 lead to large fluctuations of the oxygen saturation. Point A denotes the average Po2 for a healthy person with normal lung function living at sea level, whereas Point B denotes the average Po2 for a healthy person living at ∼1,600 m in elevation. This position lies closer to the steeper portion of the dissociation curve than in an individual at sea level.

