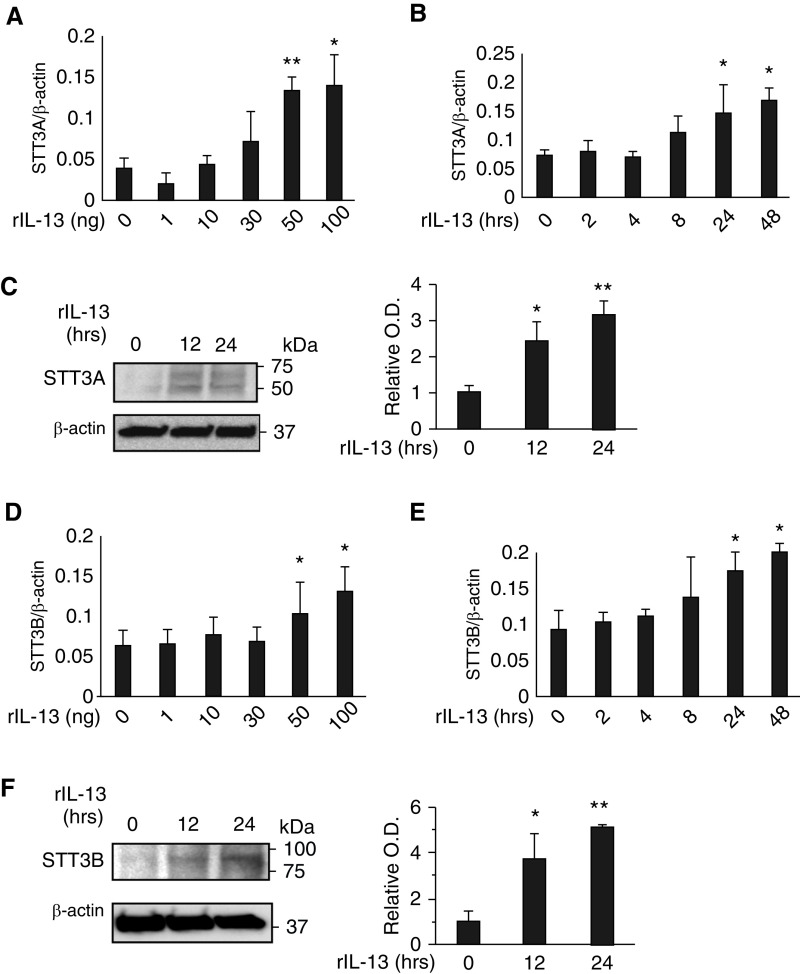
Figure 5.
Effects of IL-13 on catalytic components of OST. MLE12 lung epithelial cells were stimulated with rIL-13 to determine IL-13 regulation of STT3A and STT3B. (A and B) The mRNA expression of STT3A gene detected by qRT-PCR in the cells stimulated with different doses (A) and time points (B) of rIL-13. (C) Representative IBs detecting STT3A protein expression in the MLE12 cells at different time points of rIL-13 (50 ng/ml) stimulation. (D and E) The mRNA expression of STT3B gene detected by qRT-PCR in the cells stimulated with different doses (A) and time points (B) of rIL13. (F) A representative IB detecting STT3B protein expression in MLE12 cells with different time points of rIL-13 (50 ng/ml) stimulation. The values in A, B, D, and E represent mean ± SEM in triplicated samples in a minimum of two separate experiments. (C and F) Representative of a minimum of three evaluations. The bar graphs to the right of the IBs in C and F illustrate the relative quantities of STT3A and STT3B from three experiments measured by densitometric image analysis. *P < 0.05 and **P < 0.01 compared with vehicle controls.

