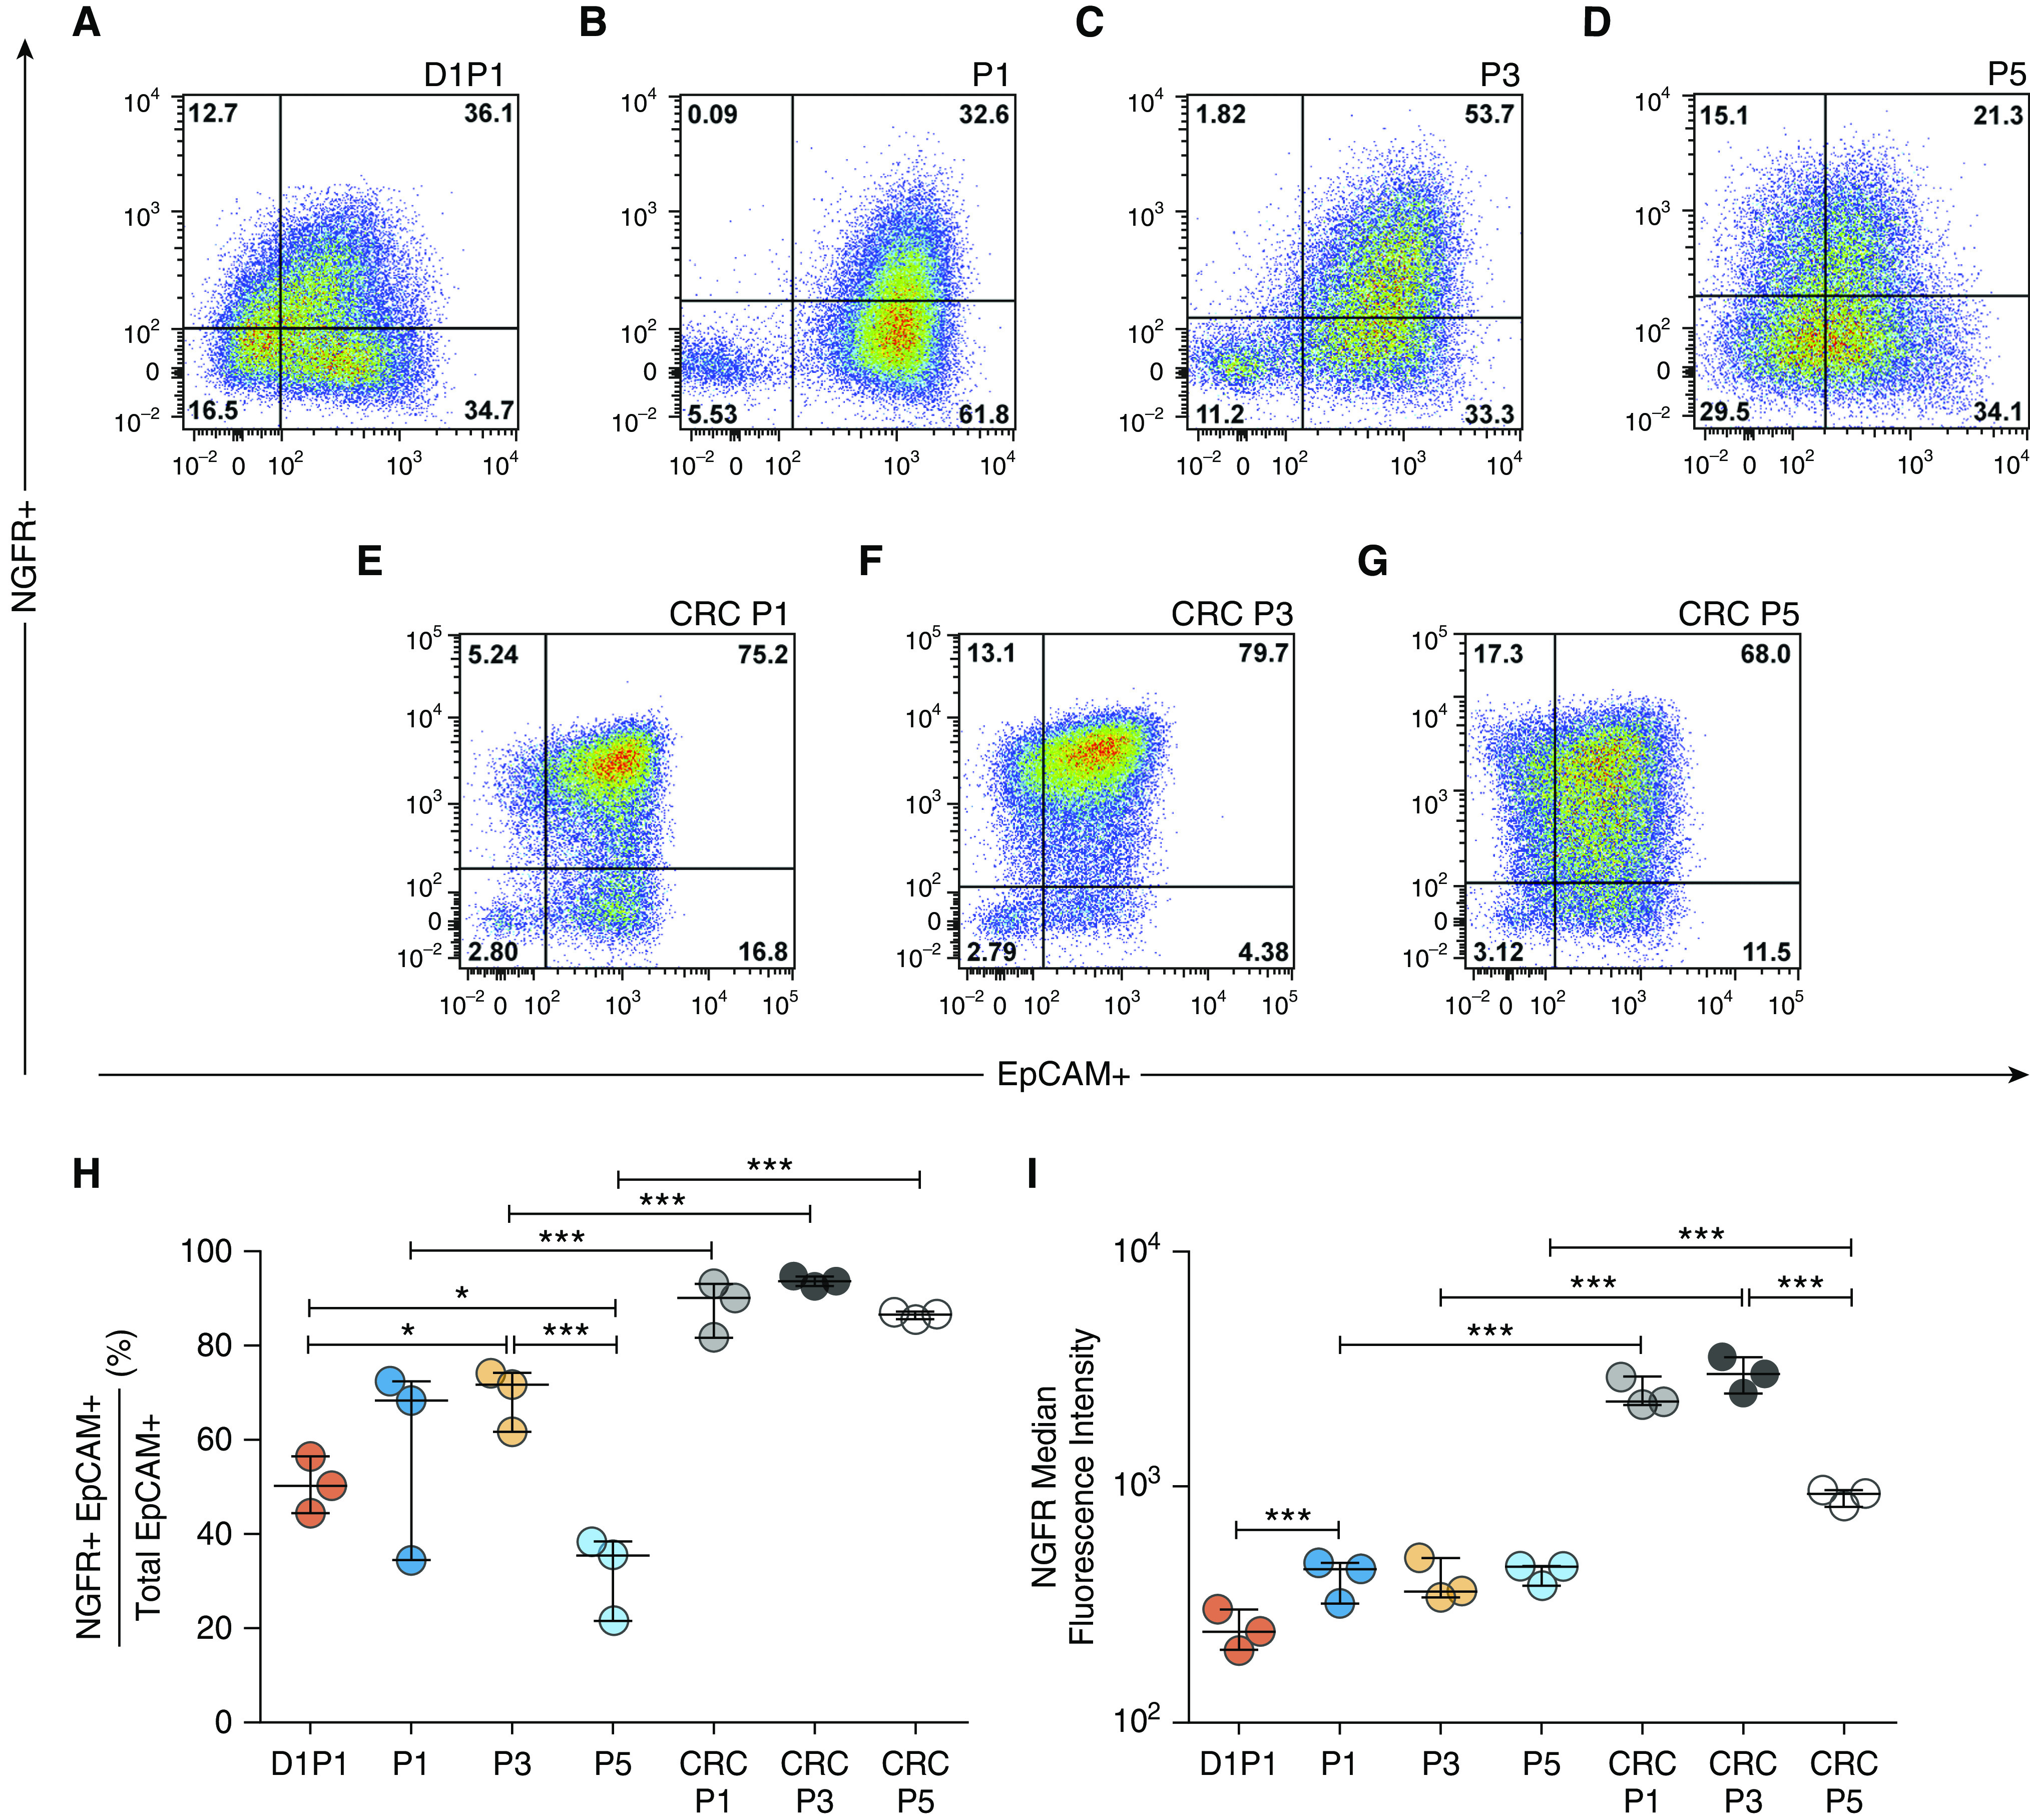
Figure 1.

Assessment of NGFR (nerve growth factor receptor) protein in airway epithelial progenitor populations. (A–G) Representative flow cytometry plots from a single human donor. Shown are (A) 1 day to passage 1 (D1P1), (B) P1, (C) P3, (D) P5, (E) conditionally reprogrammed cell (CRC) P1, (F) CRC P3, and (G) CRC P5. The gating strategy for each population can be seen in Figure E2. (H) NGFR median fluorescence intensity. (I) Percentage of NGFR+EpCAM+ cells out of total EpCAM+ cells (Table E2). Biological n = 3 donors; one replicate per donor. *P < 0.05 and ***P < 0.001. Data are presented as median and interquartile range. EpCAM = epithelial cell adhesion molecule.
