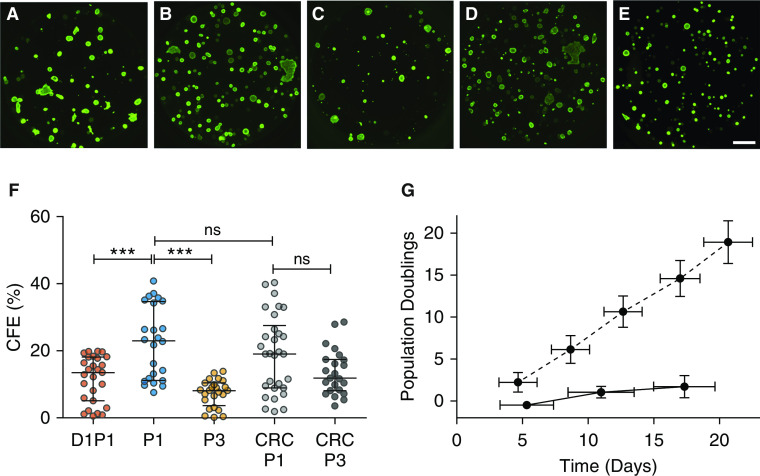
Figure 3.
CFE and growth curve of five candidate lung progenitor populations. Representative images of bronchospheres from: (A) D1P1, (B) P1, (C) P3, (D) CRC P1, and (E) CRC P3. Scale bar, 1 mm. (F) Average CFE of each candidate lung progenitor population (Table E5). Biological n = 8–10 donors; two to three replicates per donor. ***P < 0.001. (G) Growth curves comparing BEGM (solid line) versus CRC (dashed line) growth methods. Biological n = 3; one replicate for each donor. Data are presented as median and interquartile range.

