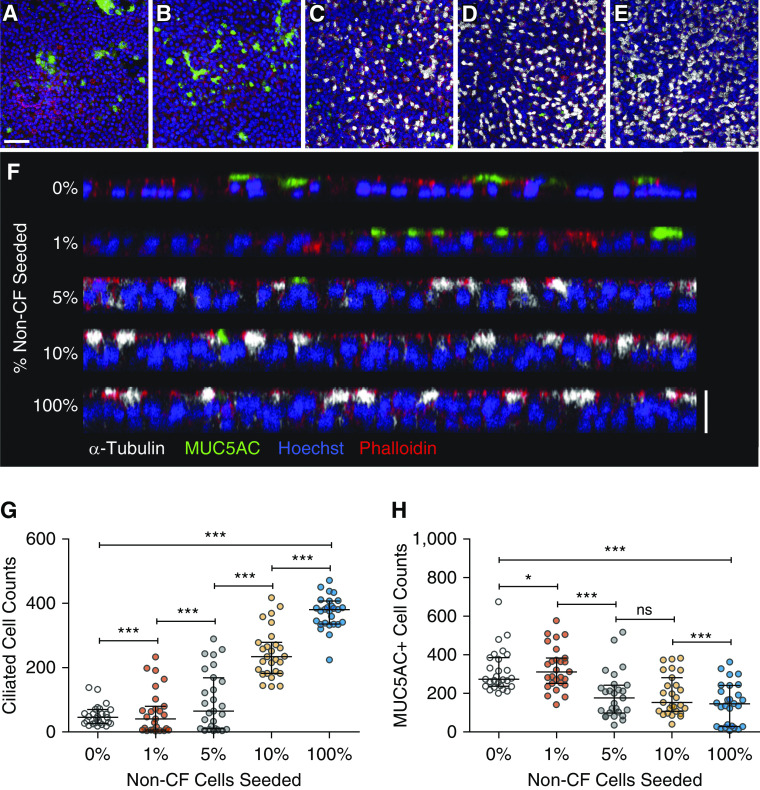
Figure 4.
Cell morphology in the competitive repopulation assay. (A–E) Representative images of mature air–liquid interface (ALI) cultures coseeded with UNCCF7T cells and varying percentages of CRC P1 non-CF cells. White, α-tubulin (ciliated cells); green, MUC5AC (mucin 5AC); blue, Hoescht; and red, phalloidin (F actin). Scale bar, 50 μm. (A) 0% non-CF, (B) 1% non-CF, (C) 5% non-CF, (D) 10% non-CF, and (E) 100% non-CF. (F) Orthogonal view of the same representative images. Note the change from a single monolayer, produced by the CF cell line, to a pseudostratified epithelium with more ciliated cells and fewer MUC5AC-expressing cells as more non-CF cells are added. Scale bar, 20 μm. (G) Number of ciliated cells present in the mature ALI culture. (H) Number of MUC5AC+ cells present in the mature ALI culture. Biological n = 3 donors; one replicate per donor. Nine representative fields (291 × 291 μm) per ALI culture were quantified. *P < 0.05 and ***P < 0.001. Data are presented as median and interquartile range.

