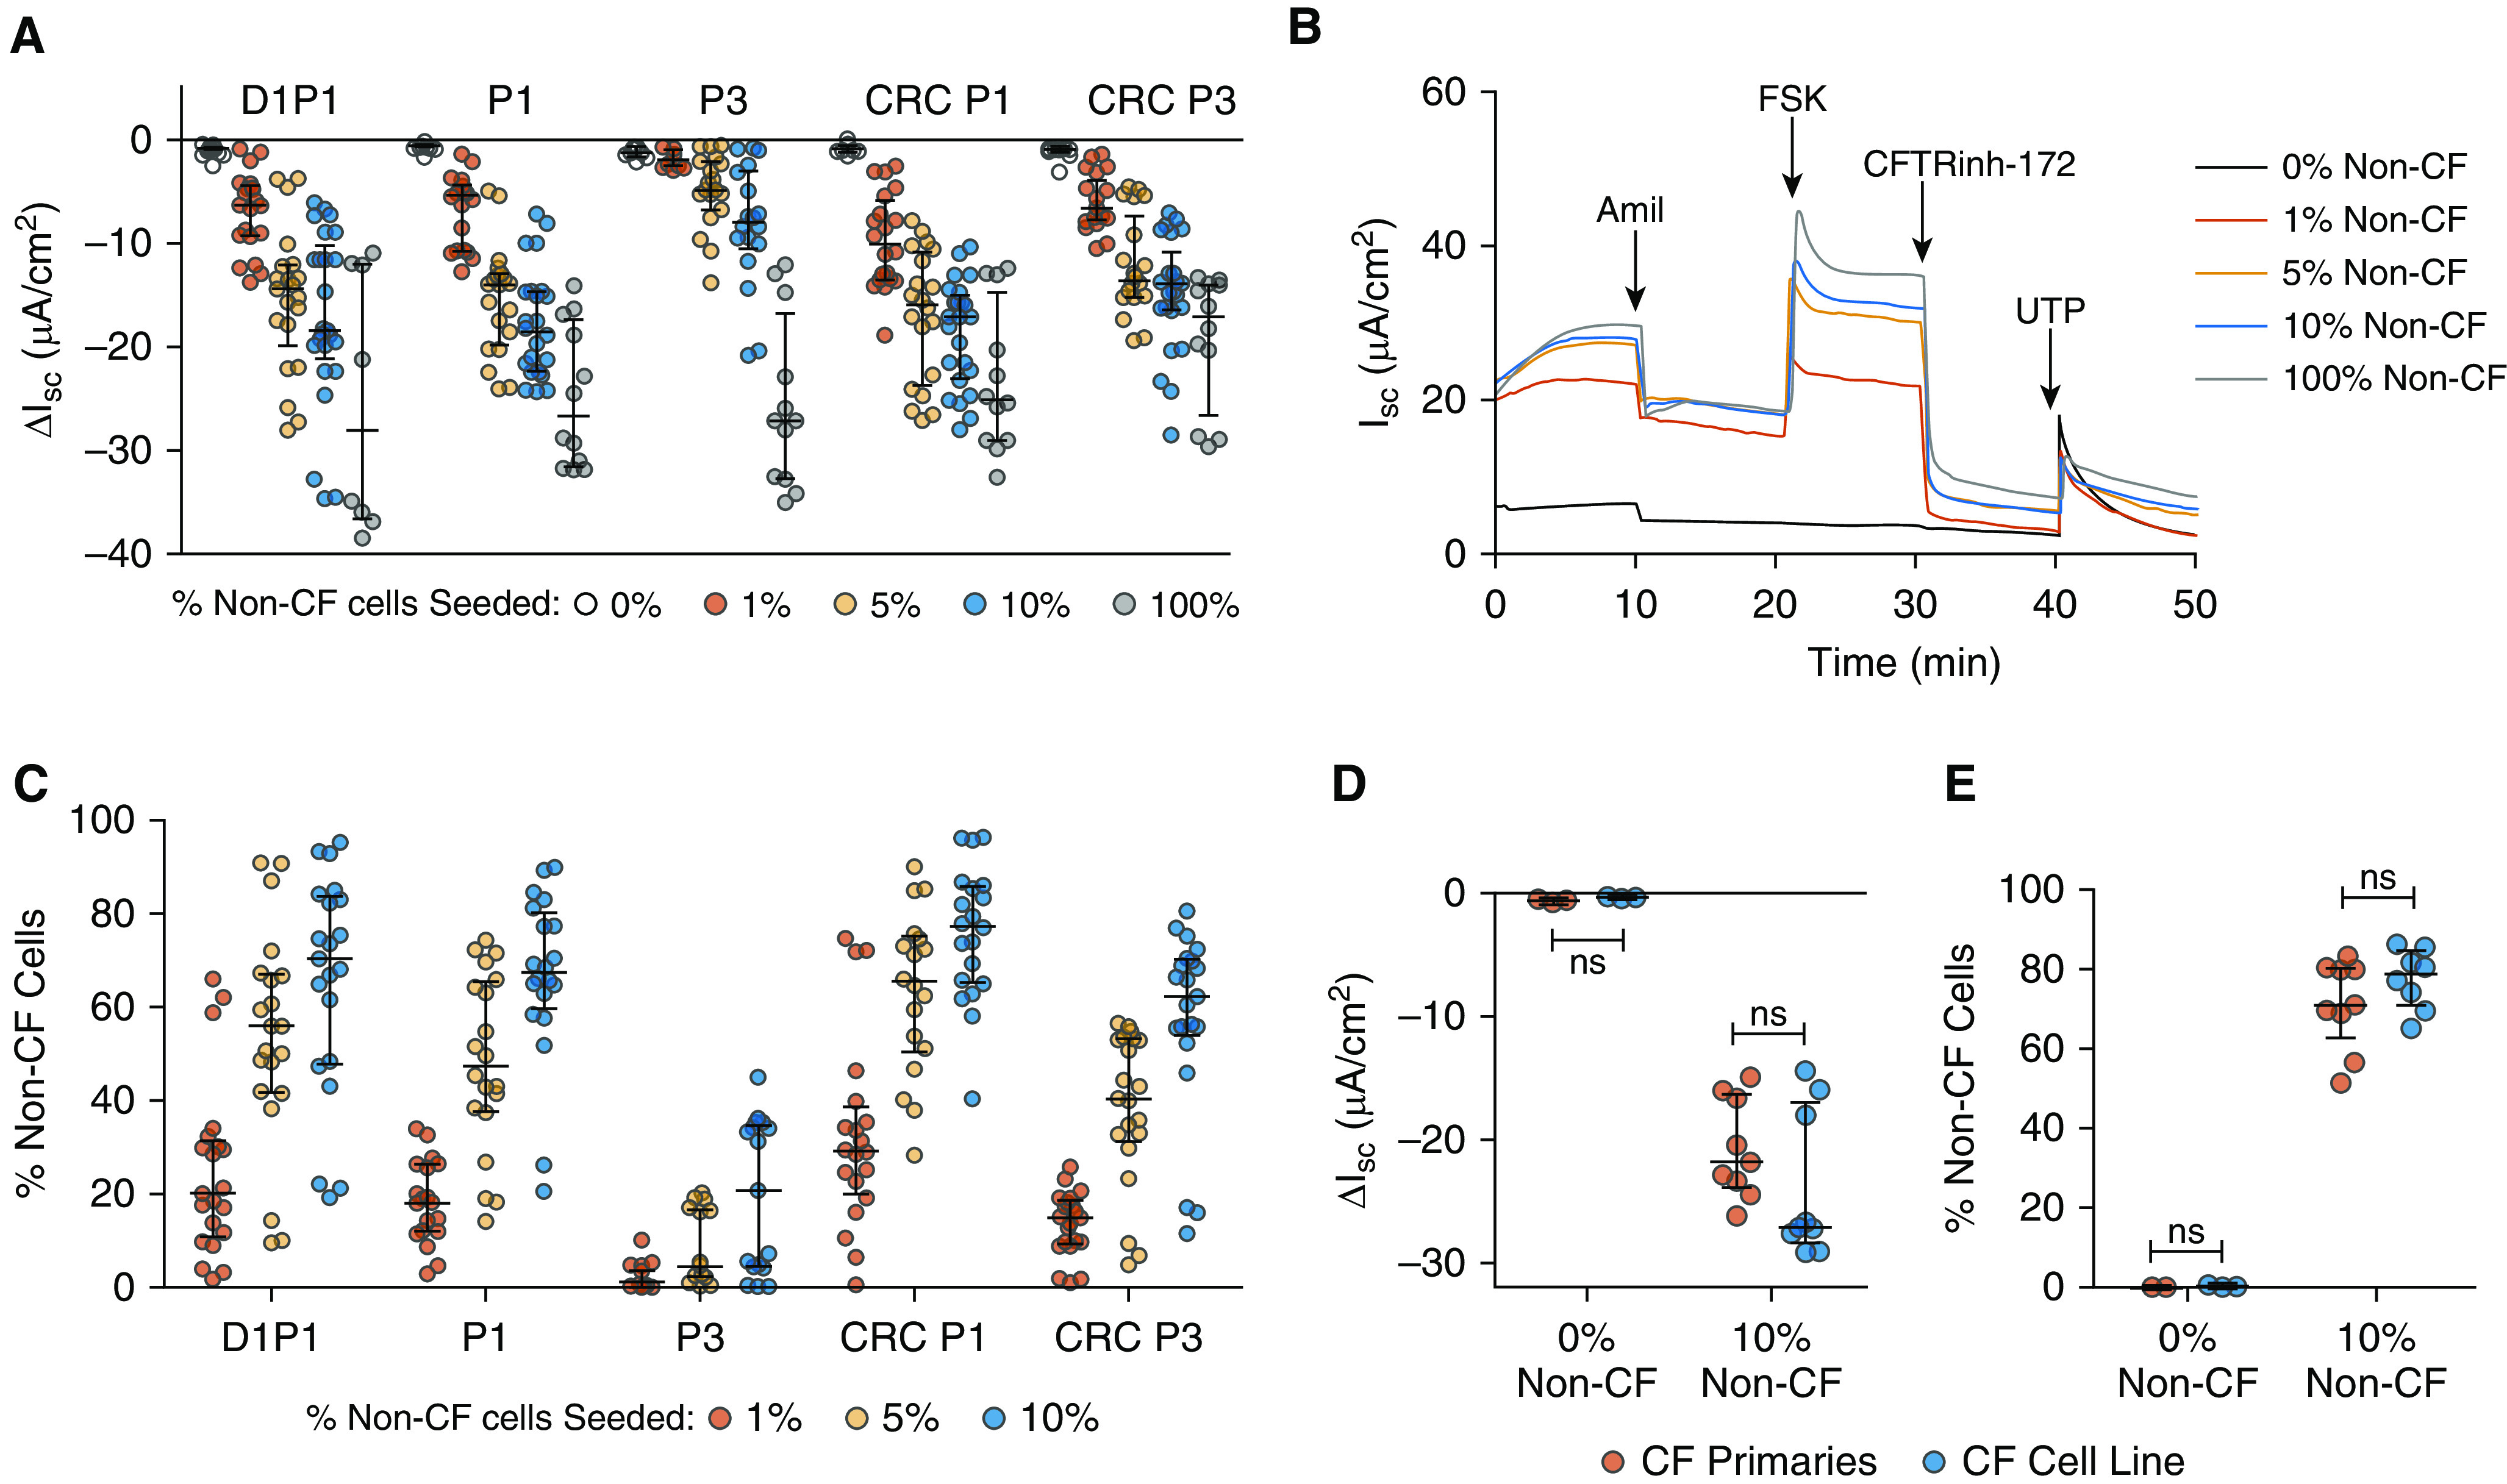
Figure 5.

Competitive repopulation by five candidate lung progenitor populations. (A and B) Comparison of the five populations seeded at 0%, 1%, 5%, 10%, and 100% non-CF cells in the competitive repopulation assay. (A) Average short-circuit current response to CFTRinh-172 (Table E6). Biological n = 6–7 donors; two to three replicates per donor. (B) Representative Ussing tracings of the CRC P1 population depicting a dose–response relationship between the percent non-CF cells seeded and the Ussing response. Amil = amiloride; FSK = forskolin; UTP = uridine-5′-triphoshpate. (C) Percent non-CF cells between Days 24–32 in ALI cultures, measured by digital droplet PCR (ddPCR; see Table E7). (D and E) Comparison of CRC P1 cells seeded at 10% non-CF cells in the competitive repopulation assay with either the UNCCF7T cell line (blue) or the primary cells from which the cell line was derived (red). (D) Short-circuit current response to CFTRinh-172. (E) Percent non-CF cells present in ALI cultures between Days 24–32. Biological n = 3 donors; two to three replicates per donor. P values for (A and C) are given in Tables 1 and 2. Data are presented as median and interquartile range.
