
Figure 6.
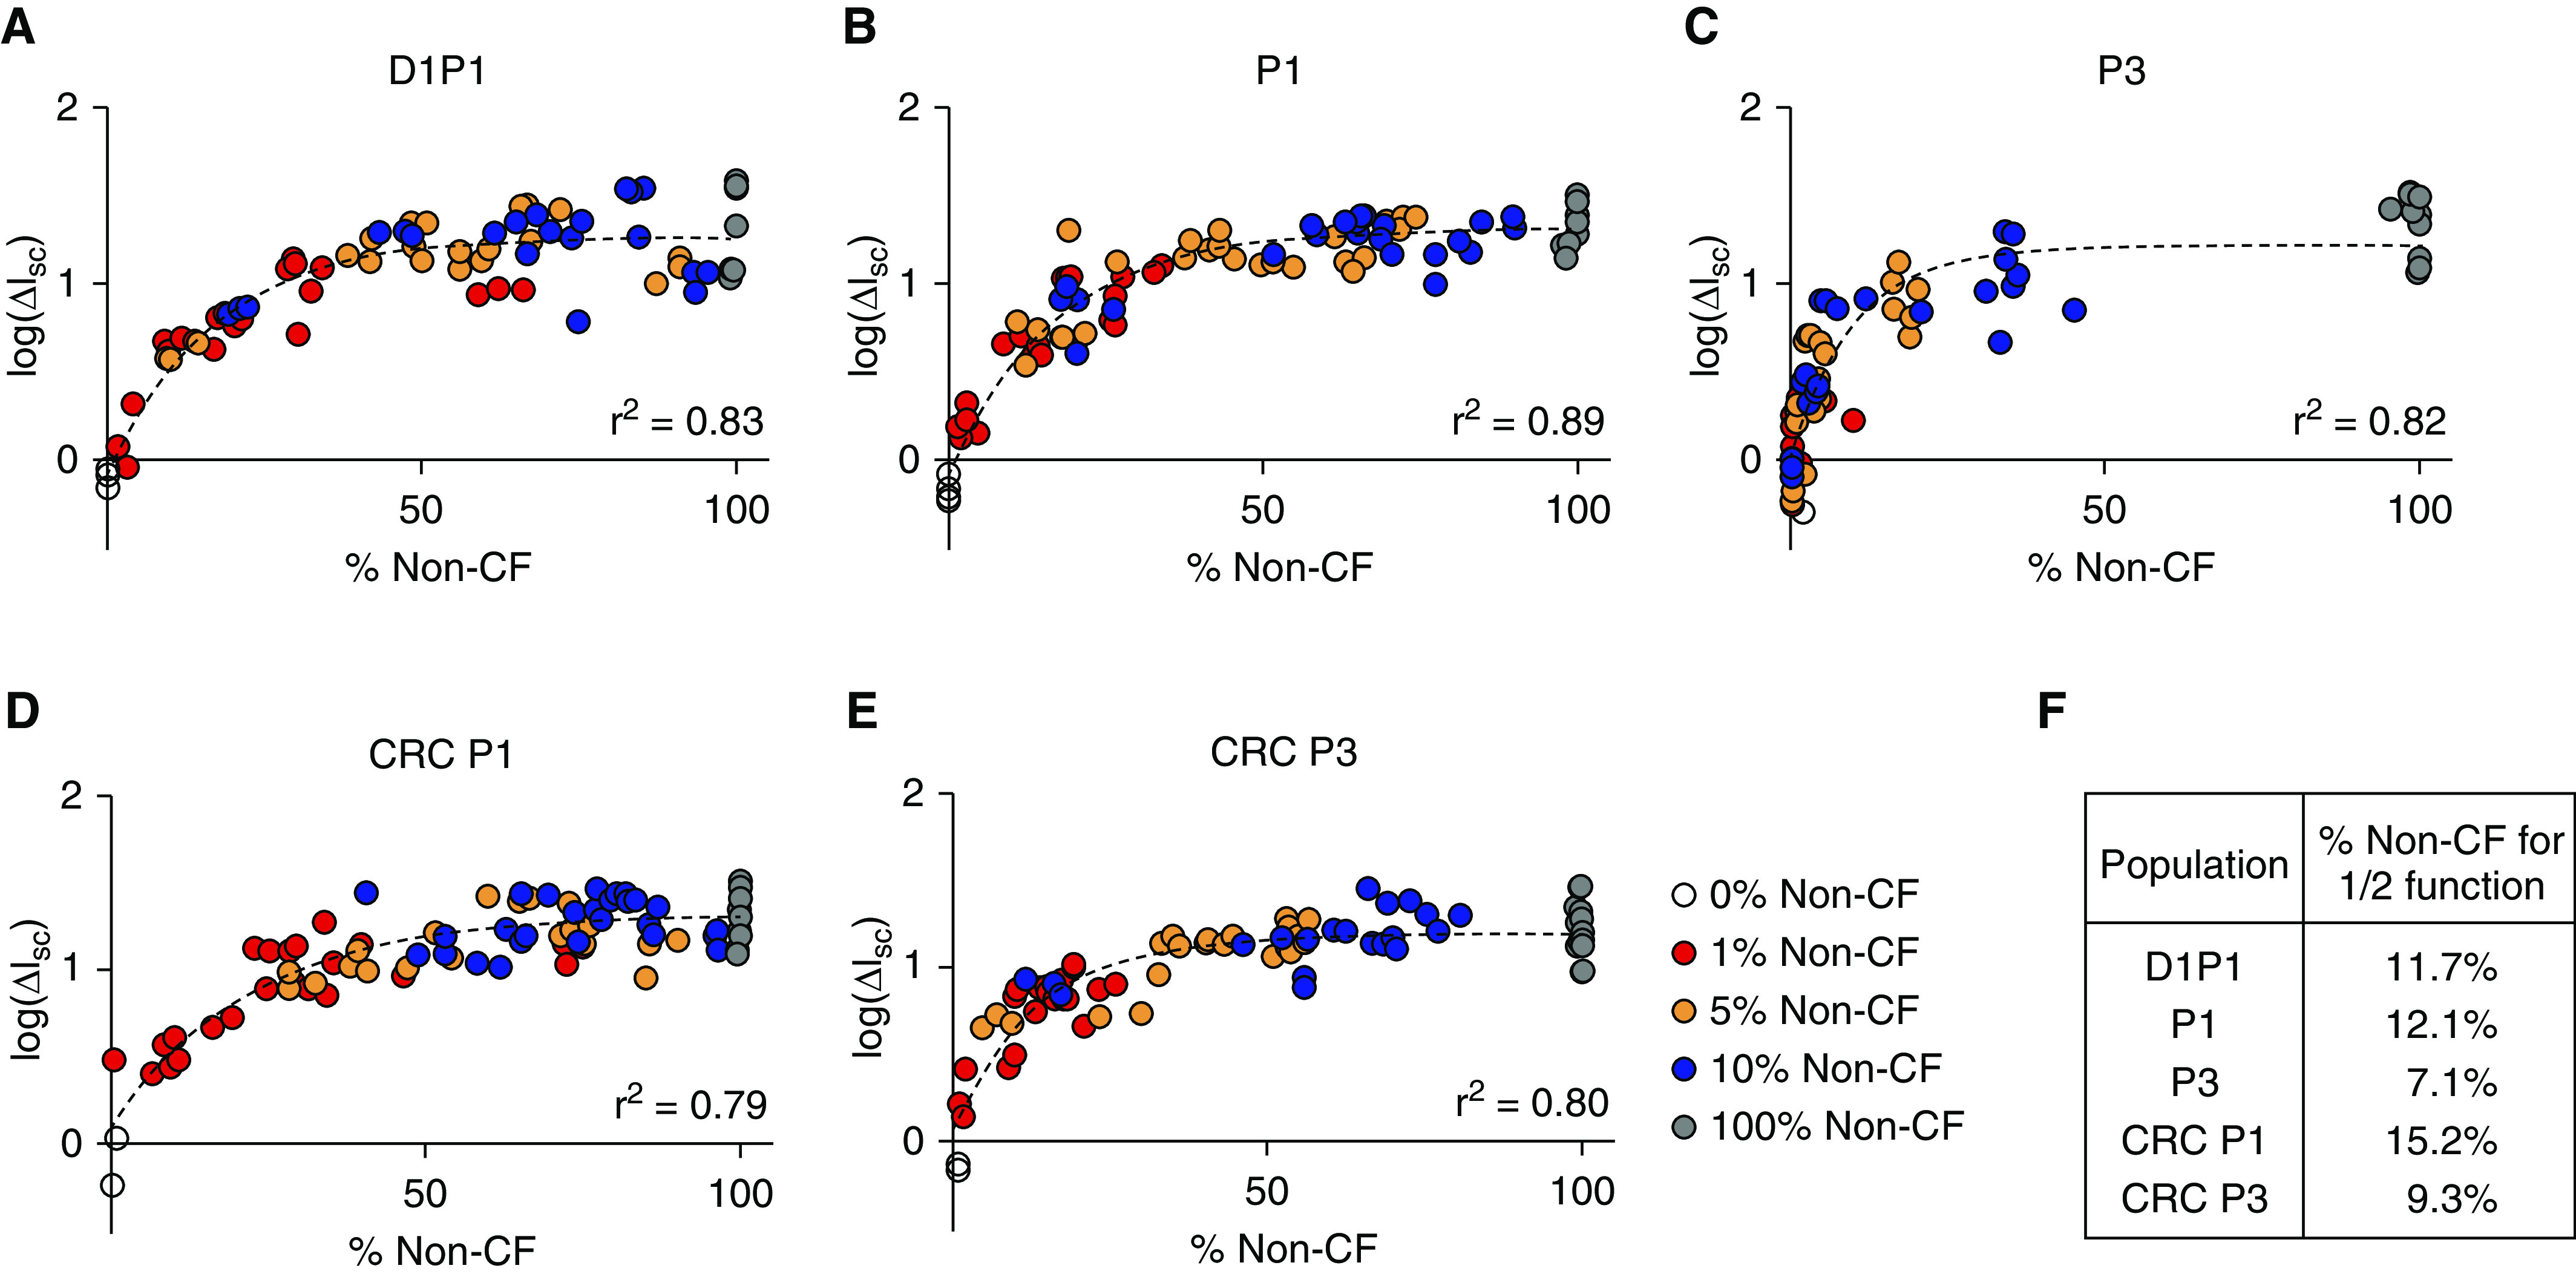
CFTR ion transport function exceeds the proportion of non-CF cells seeded. The log of the CFTRinh-172 short-circuit current response as a function of the percent non-CF (A) D1P1, (B) P1, (C) P3, (D) CRC P1, and (E) CRC P3 cells between Days 24–32 (the time of Ussing studies). Biological n = 3–4 donors for the 100% condition; n = 6–7 for all other conditions; two to three replicates per donor. An extra sum-of-squares F test was performed for each population to compare the goodness of fit between linear and one-phase decay models. In each case, a one-phase decay model was a better fit for the data (see Table E10). (F) The percentage of non-CF cells required to achieve 50% function was calculated by constraining one-phase decay models to plateau at the mean 100% non-CF CFTRinh-172 response.