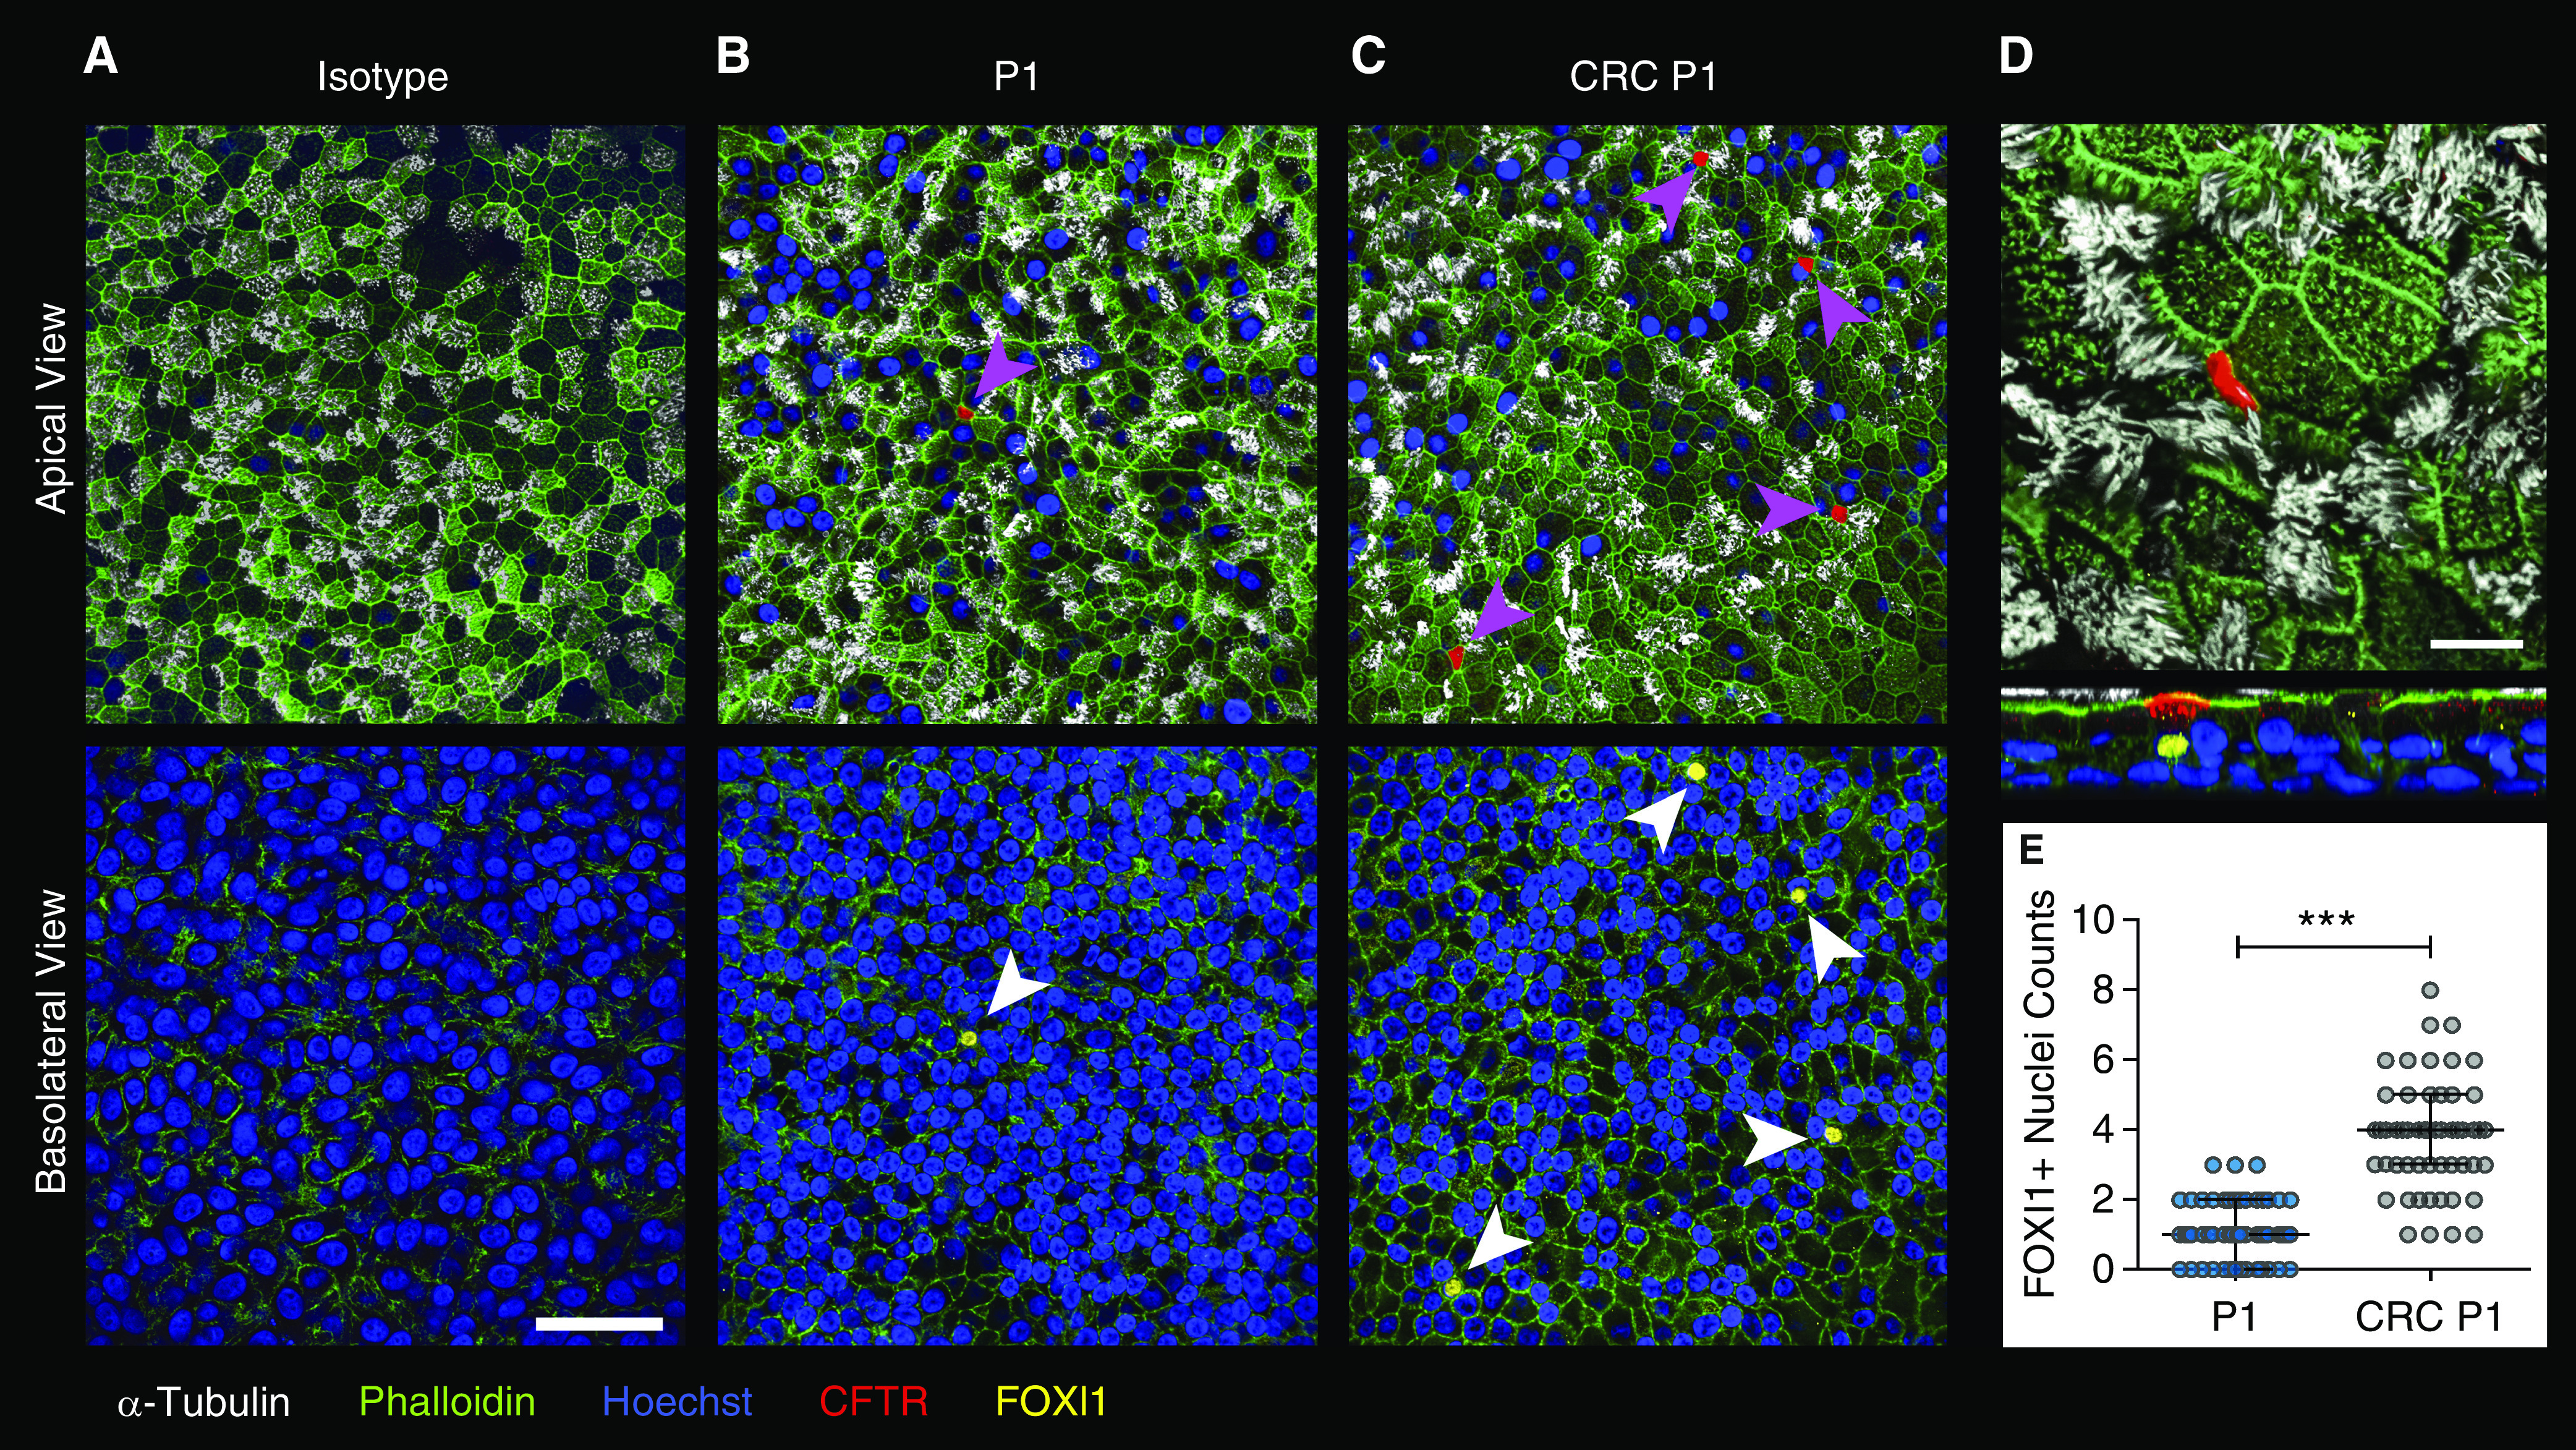
Figure 7.

CRCs generate greater numbers of ionocytes. (A–C) Representative apical and basolateral views of non-CF P1 (A and B) and CRC P1 (C) HBEC ALI cultures. (A) Isotype control for both forkhead box I1 (FOXI1) and CFTR antibodies, (B) P1, and (C) CRC P1 stained for α-tubulin (white, ciliated cells); green, phalloidin (F actin); blue, Hoescht; red, CFTR; and yellow, FOXI1. Magenta arrowheads indicate CFTR-high cells. White arrowheads indicate FOXI1+ nuclei. Scale bar, 50 μm. (D) Apical and X–Z views of a CFTR-high expressing FOXI1+ ionocyte. Scale bar, 10 μm. (E) Quantitation of FOXI1+ nuclei in P1 and CRC P1 ALI cultures. Biological n = 3 donors; two replicates per donor. Nine representative 212 × 212-μm fields were quantified per ALI culture. ***P < 0.001. Data are presented as median and interquartile range.
