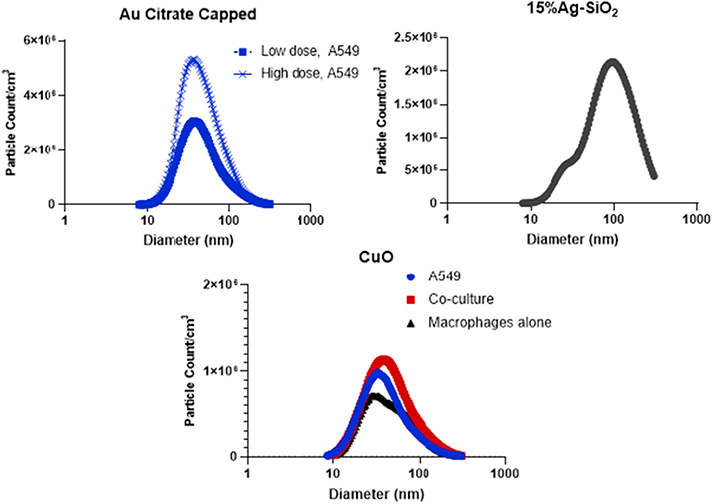
Fig. 2.
Particle counts and particle size distribution of low and high dose of Au citrate capped NPs, 15% Ag-SiO2 and CuO NPs generated for the exposure of A549 cell, co-culture or macrophages only. Data for the 15% Ag-SiO2 were obtained from separate experiments under the same nebulizer operating conditions. Measurements were performed by SMPS, geometric mean (GM) and geometric standard deviation (GSD) are reported in Table 2.

